Virtual Services are monitored by the NSX Advanced Load Balancer and system events are generated. The events are used for reactive troubleshooting and proactively triggering alerts to the user. These events are filtered for display based on the context in which they are viewed.
Virtual Service Events Log
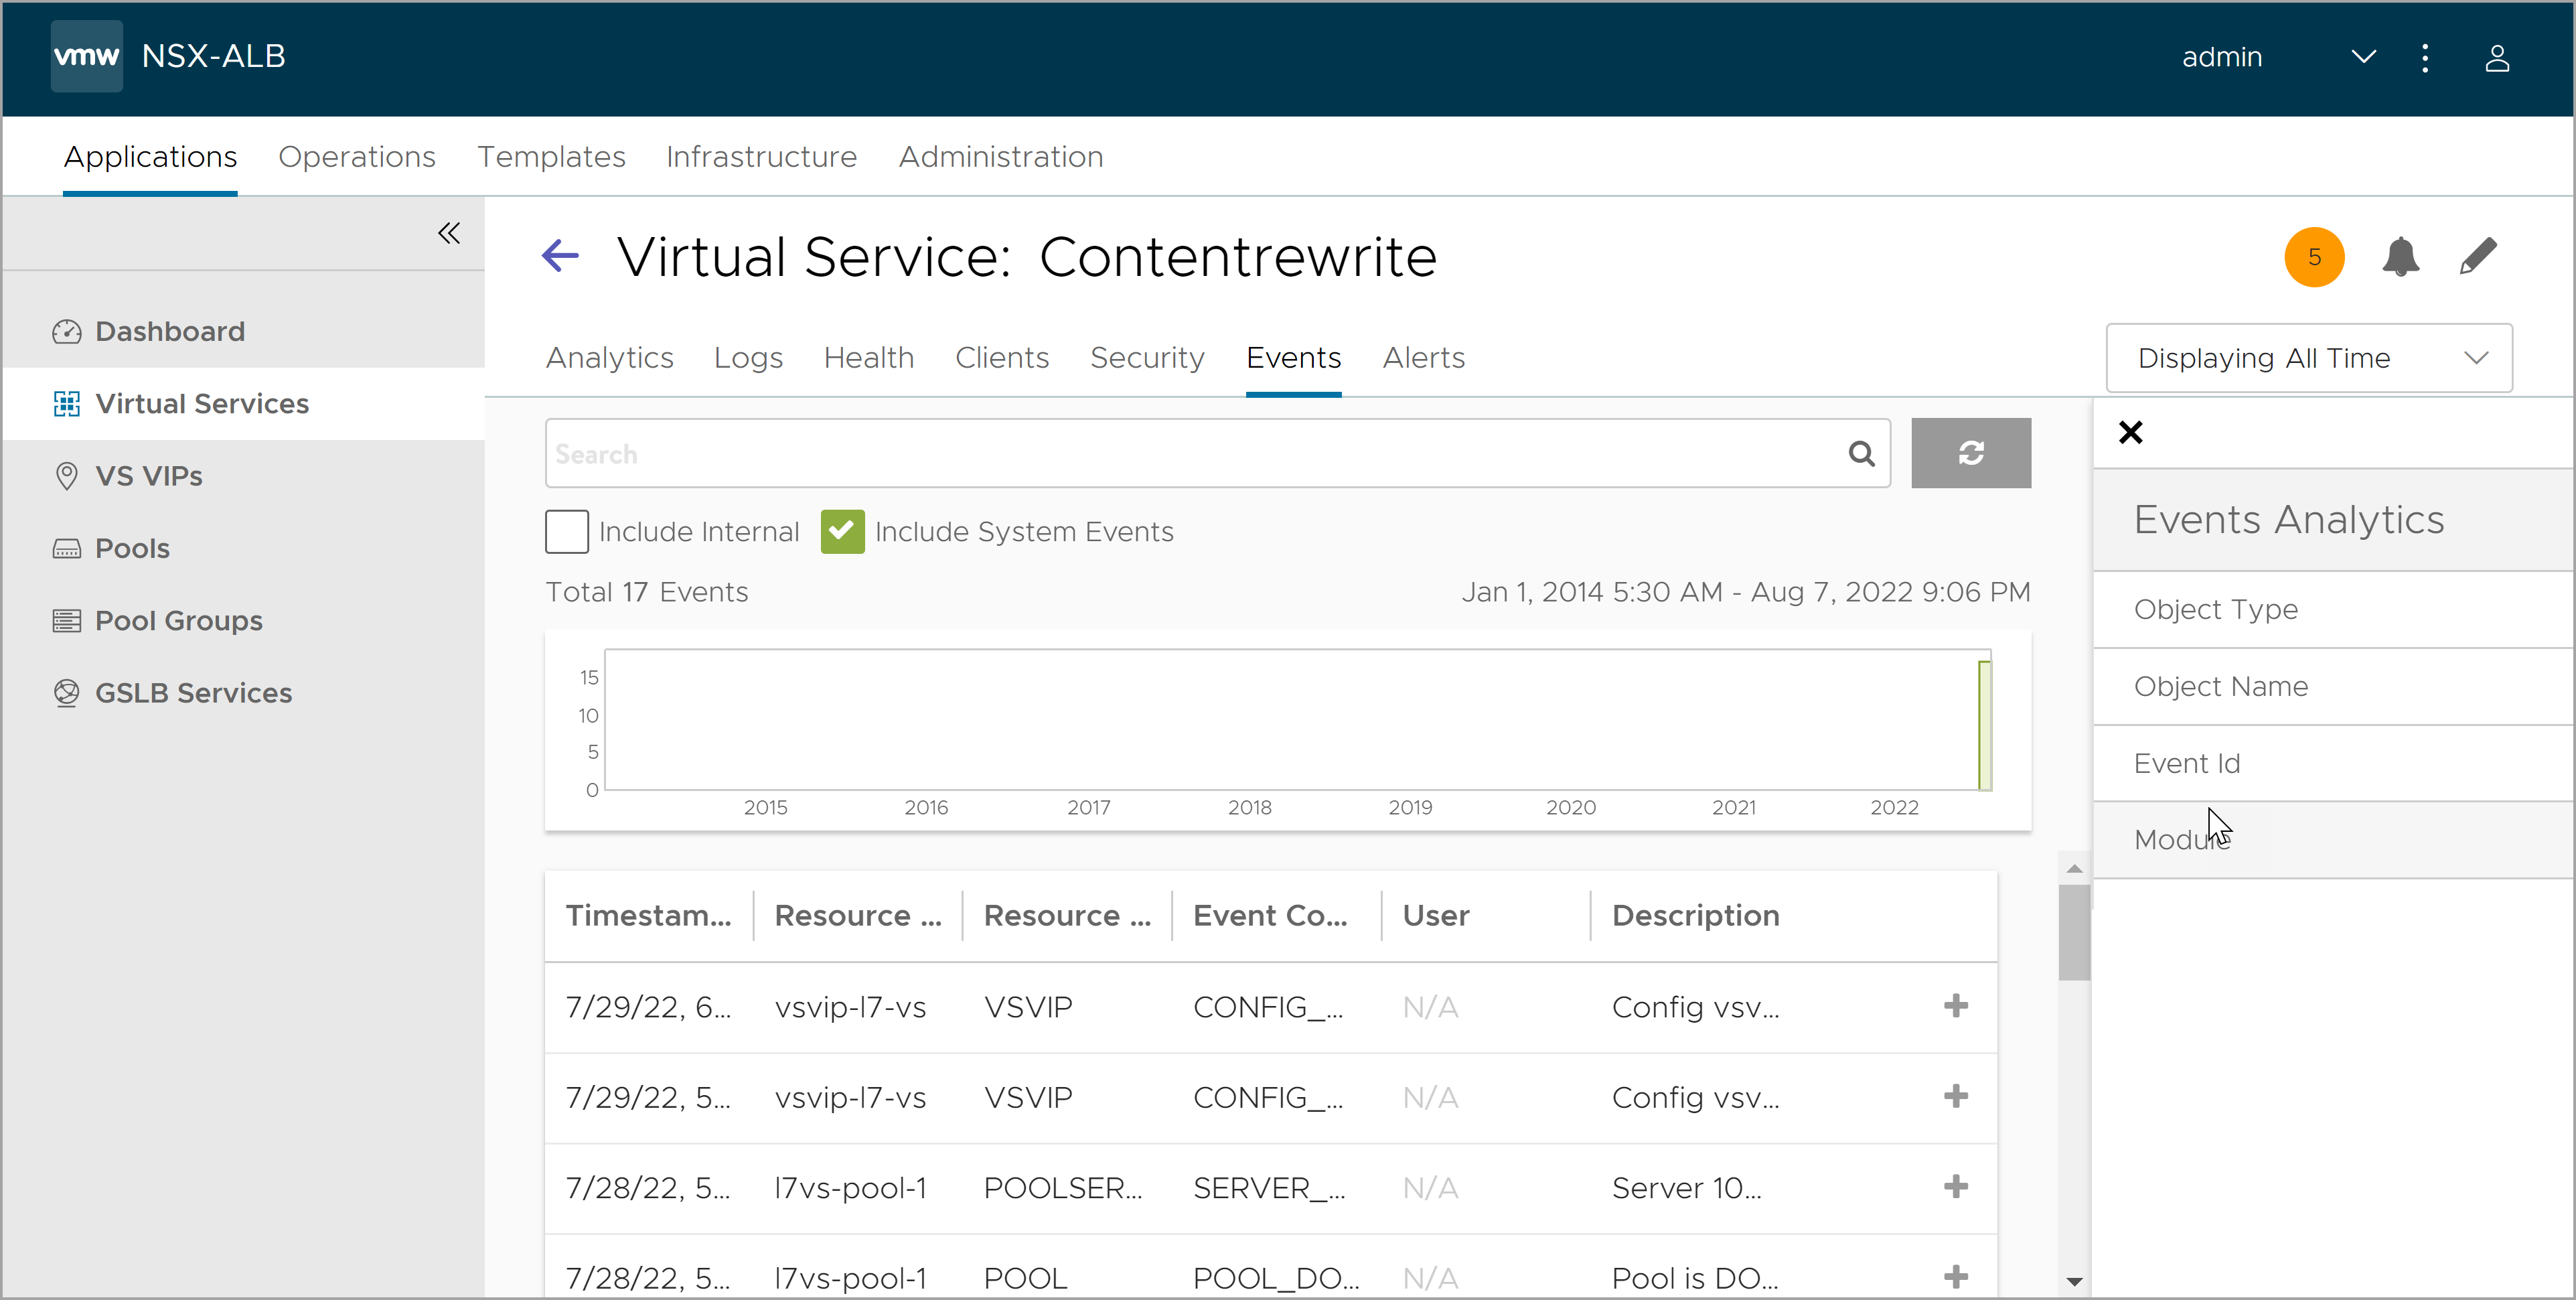
The Events tab presents system-generated events over the time period selected for the virtual service. System events are applicable to the context in which they are viewed. For example, when viewing events for a virtual service, only events that are relevant to that virtual service are displayed.
Navigate to . Click a virtual service. The Events tab displays the events that matched the current time window and any potential filters.
Field |
Description |
|---|---|
Search |
The Search field allows you to filter the events using whole words contained within the individual events. |
Refresh |
Updates the events that are displayed for the selected time frame. |
Number |
Total number of entries displayed. The date/time range of those events appear below the Search field. |
Clear Selected |
If filters have been added to the Search field, the Clear Selected (X) icon on the right side of the search bar will remove those filters and clear selection. Each active search filter will also contain an X that can be clicked to remove a specific filter. |
Histogram |
The Histogram shows the number of events over a selected time per. The X-axis represents time, while the Y-axis shows the number of events that occurred during a period, represented as a bar. |
Include Internal |
By default, a number of events are not shown as they tend to be noisy and less relevant for general purpose. The NSX Advanced Load Balancer support can ask to enable this option to troubleshoot more obscure issues. |
Include System Events |
System generated configuration events are displayed by default. To exclude system generated configuration events, deselect the Include System Events check box. |
The events that matched the input are displayed in the results. The information displayed for each event in the result is detailed in Table 2.
Field |
Description |
|---|---|
Timestamp |
Date and time the event occurred. Highlighting a section of the Histogram allows filtering of events within a smaller time window. |
Event Type |
This page is scoped to only show Configuration event types. Configuration events track changes to the NSX Advanced Load Balancer configuration. These changes can be made by an administrator (through the CLI, API, or GUI), or by automated policies. |
Resource Name |
Name of the object related to the event. For User_Login Events, this shows the username of the user that attempted to log in. |
Event Code |
A short event definition such as User_Login, Config_Create, Config_Modify, or Config_Delete. |
Description |
A complete event definition. For configuration events, the description includes name of the account user that made the change. |
Expand/Contract |
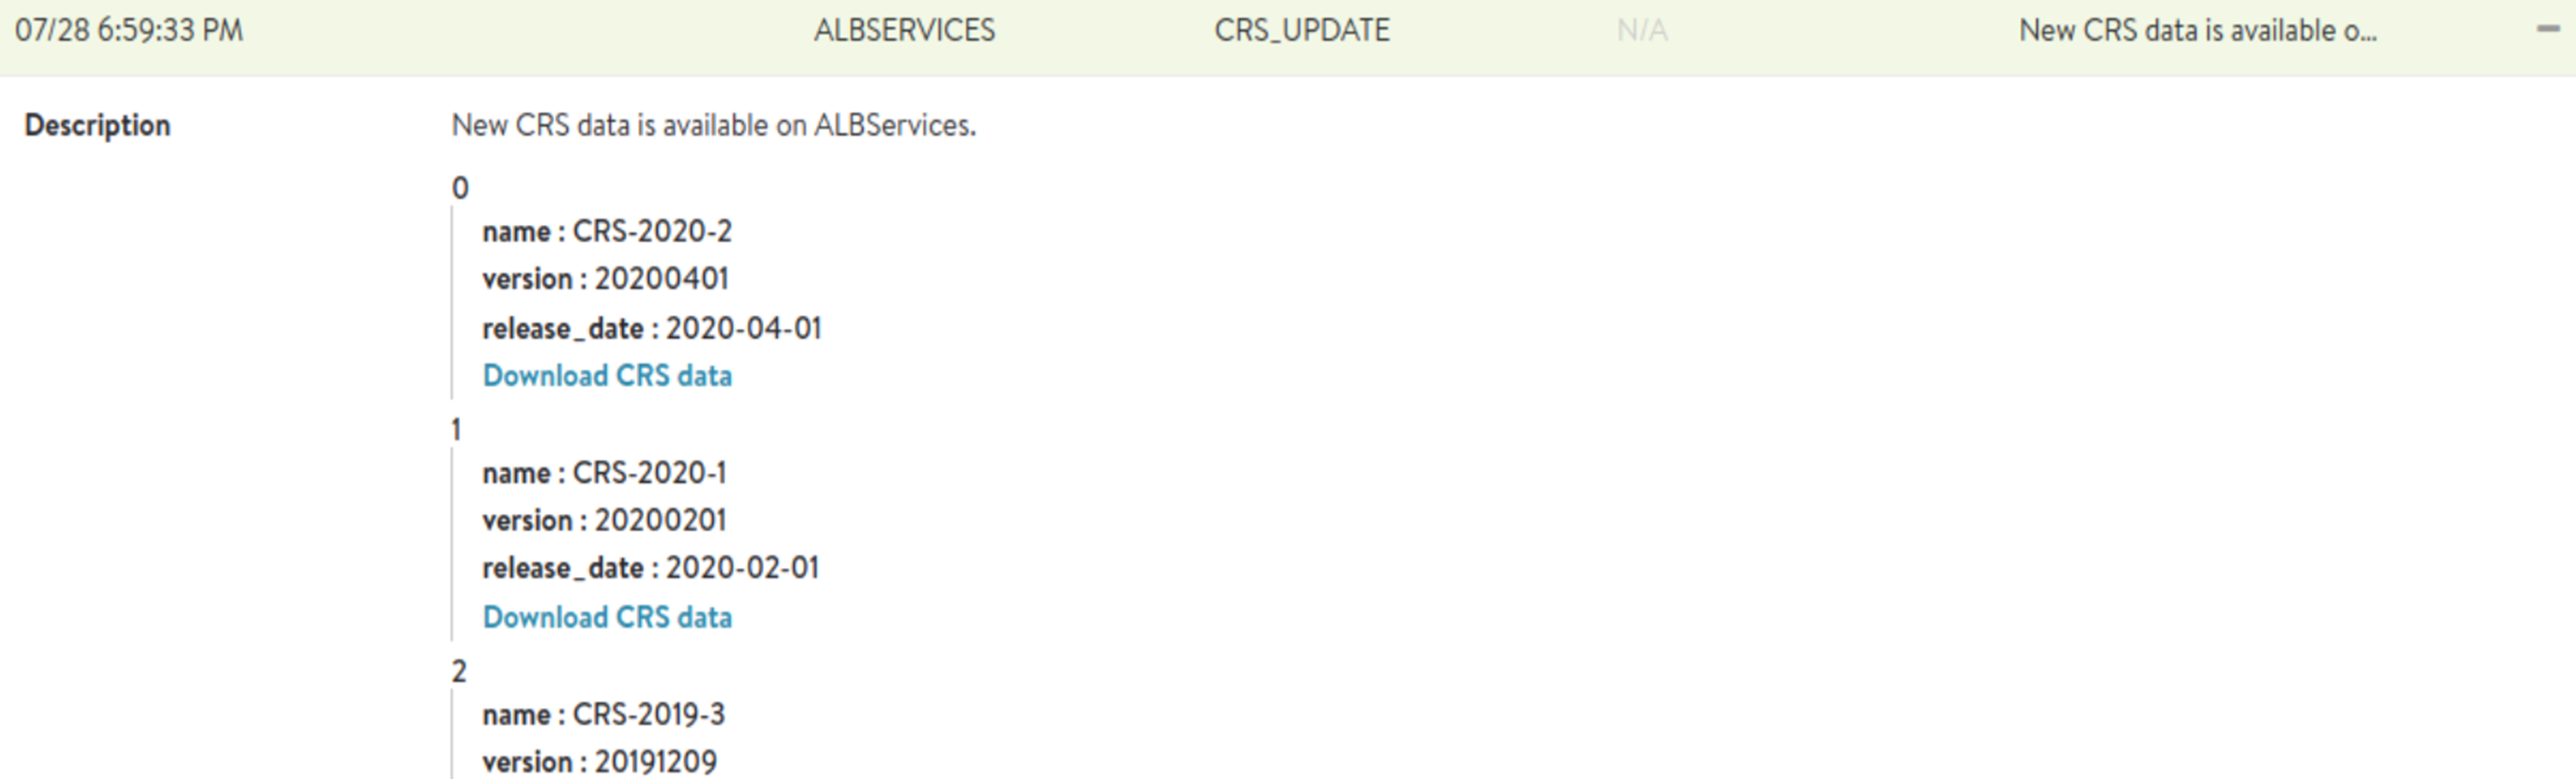
Clicking the + plus or - minus sign for an event log either expands that event log to display more detail or contracts that event log to display only summary information. For configuration update events, expanding the event log highlights differences between the previous and updated configurations. The updates are color coded to indicate the type of update:
|
For configuration events, expanding the event displays a difference comparison between the previous and new configurations.
New fields will appear highlighted in green in the new configuration.
Removed fields will appear highlighted in red.
Changed fields will show highlighted in yellow.
Viewing Events for Debugging WAF Signature
You can view events for debugging WAF Signature issues as follows: