


This section explains the integration of NSX Advanced Load Balancer with Prometheus and how to authenticate Prometheus scrape requests.
Prometheus is an open-source systems monitoring and alerting toolkit that joined the Cloud Native Computing Foundation (CNCF) in 2016. Unlike other common monitoring solutions, Prometheus metrics collection uses a pull method utilizing HTTP. For more information on Prometheus, see Prometheus home page.
Prometheus API Spec
The NSX Advanced Load Balancer Controller provides first class REST APIs to pull metrics (data in a format that can be ingested by Prometheus) for the following:
The Controller Cluster
Virtual Services
Service Engines
Pools
GET APIs to Fetch Prometheus Metrics
The GET API to fetch Prometheus metrics is as below:
GET /api/analytics/prometheus-metrics/{entity_type}/?{query_params}
Here, entity_type is the controller, virtualservice, serviceengine or pool.
Valid query parameters are as follows:
- entity_id
-
Depending on the entity type, it can be a comma-separated list of Controller node IDs, pool UUIDs, service engine UUIDs, virtual service UUIDs.
- entity_name
-
Depending on the entity_type, the entity_name is a comma-separated list of valid pool, virtual service, or service engine object names.
- metric_id
-
A comma-separated list of valid metric IDs defaults to all possible metric IDs, unless the realtime parameter is true where a subset of metrics will be returned. Use the API GET/api/analytics/metric_id to find the valid metric IDs. The complete set of metrics is provided here.
- tenant
-
A comma-separated list of tenant names, by default set to admin.
- description
-
Attaches a line of description before every metric as a comment. This parameter is by default set to false.
- realtime
-
The realtime-enabled entity responds to metrics calculated every 5 seconds when enabled, and the same is calculated at 300-second intervals if disabled. The default value is set to false and must be set to true to query realtime.
Using the API with Prometheus
Prometheus uses a pull method utilizing HTTP for metrics collection. The users provide HTTP endpoints to fetch data from and other parameters like scraping interval, additional query params, port, authorization details, and so on.
Prometheus provides two ways to authorize the HTTP scrape requests:
Basic auth
Bearer token/Bearer token file
The Prometheus endpoints exposed as APIs from the Controller require authentication, similar to all other existing Controller APIs. NSX Advanced Load Balancer provides two ways to authenticate Prometheus scrape requests to the Controller:
Setting Basic Auth for Controller APIs:
API calls from a client to the NSX Advanced Load Balancer Controller can be setup to use Basic Auth as the authentication mechanism for Controller APIs. To know how to enable basic auth on the Controller , see HTTP Basic Auth for API Queries topic in the VMware NSX Advanced Load BalancerConfiguration Guide.
Use the basic_auth parameter under scrape_config to setup basic auth for prometheus scrape requests in the
prometheus.ymlfile. A sampleprometheus.ymljob config using abasic_authenabled controller setup is shown below.job_name: 'avi_vs' scrape_interval: 300s metrics_path: '/api/analytics/prometheus-metrics/virtualservice' params: entity_name: ['prod-vs1,prod-vs2'] tenant: ['admin,tenant1'] scheme: 'https' tls_config: insecure_skip_verify: true basic_auth: username: '[username]' password: '[password]' static_configs: - targets: ['[avi_controller_cluster]']Note:Prometheus allows users to pass the CA file path, client certificate, and key files for TLS configuration under the tls_config parameter. In the sample config, the certificate check has been skipped using the
insecure_skip_verify.
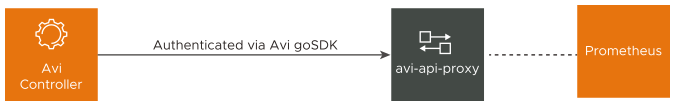
Using avi-api-proxy:
avi-api-proxy is a dockerized proxy container built over NSX Advanced Load Balancer 's SDK, which is responsible for handling authentication and session management with NSX Advanced Load Balancer Controller's API server. All the HTTP REST API calls (GET, POST, PUT, DELETE) to avi-api-proxy are forwarded to the Controller API server with valid authorization headers and cookies. The response from the Controller is returned back to the requesting client application, in this case the Prometheus setup.
A sample
prometheus.ymljob config usingavi-api-proxyis shown below.- job_name: 'avi_vs' scrape_interval: 300s metrics_path: '/api/analytics/prometheus-metrics/virtualservice' scheme: 'http' params: entity_name: ['prod-vs1,prod-vs2'] tenant: ['admin,tenant1'] static_configs: - targets: ['172.17.0.2:8080'] ## 172.17.0.2 is the avi-api-proxy ip assigned from the docker bridge networkOnce the
avi-api-proxyis up and running, no API authentication details are provided to the Prometheus configuration file (refer to the sampleprometheus.ymljob config usingavi-api-proxy). The authentication to the NSX Advanced Load Balancer Controller API server is fully managed byavi-api-proxy.Note:The target for the scrape requests specified here is the address and port where
avi-api-proxyis running. Theavi-api-proxydocker container once created, by default, runs and connects to the docker bridge network. The sample shows the bridge IP assigned to theavi-api-proxycontainer. To run the proxy in the same networknamespaceas your host machine network namespace use the--network hostcommand while running theavi-api-proxycontainer. If a new network namespace is created for docker, then to run the proxy in the new network namespace as your docker container application use the--network network namecommand.
For more information, see avi-api-proxy docker container.
The container requires the NSX Advanced Load Balancer Controller cluster address, username and password to get started.
Filtering Metrics Using Params
Add query params for an API endpoint in the prometheus config yaml using either one of the following:
The metrics_pathfield : For instance metrics_path can be specified with query params as follows:
/api/analytics/prometheus-metrics/pool/?tenant=admin,default&metric_id=l4_server.avg_bandwidth,l4_server.avg_connections_dropped
The params key: A more readable alternative for provided query params in a key value yaml format.
To minimize the response time of the API, it is advised to use the provided filters. If no params are provided, the API fetches data for all entity objects belonging to the admin tenant, consisting of all metric IDs, without description strings.
A sample Prometheus job config displaying how to use query params is shown below. The following job config fetches l4_server.avg_bandwidth and l4_server.avg_connections_dropped metrics for all pool objects in the admin and default tenant namespace, with a metric description line before the metric data.
- job_name: 'avi_pool'
    scrape_interval: 300s
    metrics_path: '/api/analytics/prometheus-metrics/pool'
    scheme: 'http'
    params:
      tenant: ['admin,default']
      metric_id: ['l4_server.avg_bandwidth,l4_server.avg_connections_dropped']
      description: 'true'
    static_configs:
      - targets: ['127.0.0.1:8080']
Further, to get metrics for specific pool objects in the admin and default tenants, use entity_name or entity_id params as follows:
params:
      entity_name: ['vs1-pool1,vs1-pool2,vs2-pool1']
      tenant: ['admin,default']
      metric_id: ['l4_server.avg_bandwidth,l4_server.avg_connections_dropped']
      description: 'true'
NSX Advanced Load Balancer provides a comprehensive set of metrics related to virtual service, pool, and SE objects. When such objects are large in number, the NSX Advanced Load Balancer Controller might take some time to compute the analytics data and return the response. Setting a low scrape_interval value might result in API timeouts. In such cases, use filter params to get relevant data and set the scrape_interval value to a minimum of 300 seconds in the Prometheus config yaml.
Advantages of Proxy
Changing the system settings to allow basic authentication enables Basic Auth on all controller APIs. This might not be the intended behavior in some scenarios. Applications communicate with the proxy over standard HTTP REST protocol similar to what is provided by the NSX Advanced Load Balancer Controller. The proxy is integrated with NSX Advanced Load Balancers go SDK to provide cookie-based authentication and session management. The proxy is instantiated using the NSX Advanced Load Balancer Controller credentials and any application running the proxy (preferably in the same network namespace) and should be able to communicate to the NSX Advanced Load Balancer Controller through avi-api-proxy.
The proxy provides the following advantages:
Session Management - The proxy uses NSX Advanced Load Balancer’s go SDK to manage session cookies, set auth headers, refresh tokens, and reuse TLS connections to reduce TLS handshakes.
Retry Requests - In case of server errors, the SDK tries to retry failed requests.
Ease of Use - No system settings change is required.
The connection between avi-api-proxy and the application (in this case, Prometheus) is an open connection. Hence, it is advised to run avi-api-proxy in the same network namespace as the application for the communication to happen over localhost.
