The section explores the WAF Analytics features available for a virtual service under its logs.
Navigate to .
Click the virtual service mapped to the WAF Policy.
Navigate to Logs and click right side panel to access Log Analytics.
The Log Analytics tab provides an option for WAF Analytics under the following sections:
WAF Tags
WAF Rules
WAF Groups
WAF Latency
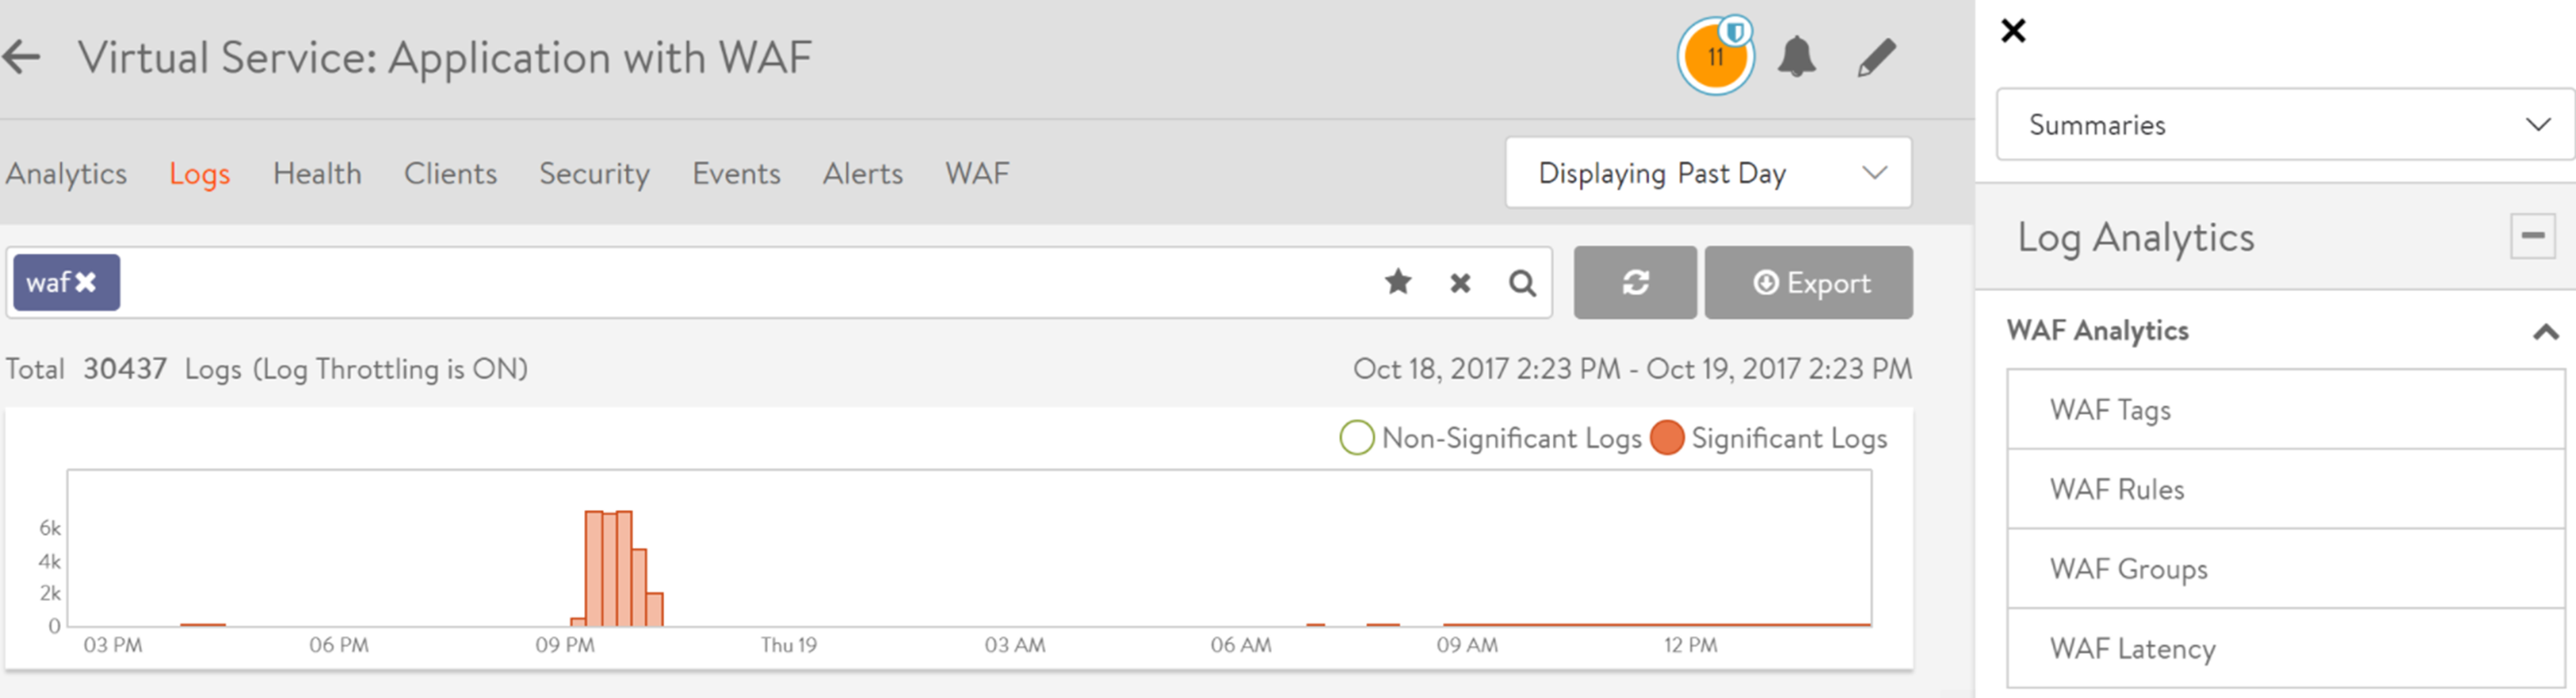
Each section provides an insight into the currently filtered traffic. Analytics can be generated based on the time frame chosen, such as Displaying Past Week, Displaying Past 6 Hours, and so on. The new WAF log analytics items can be used in conjunction with existing analytics.
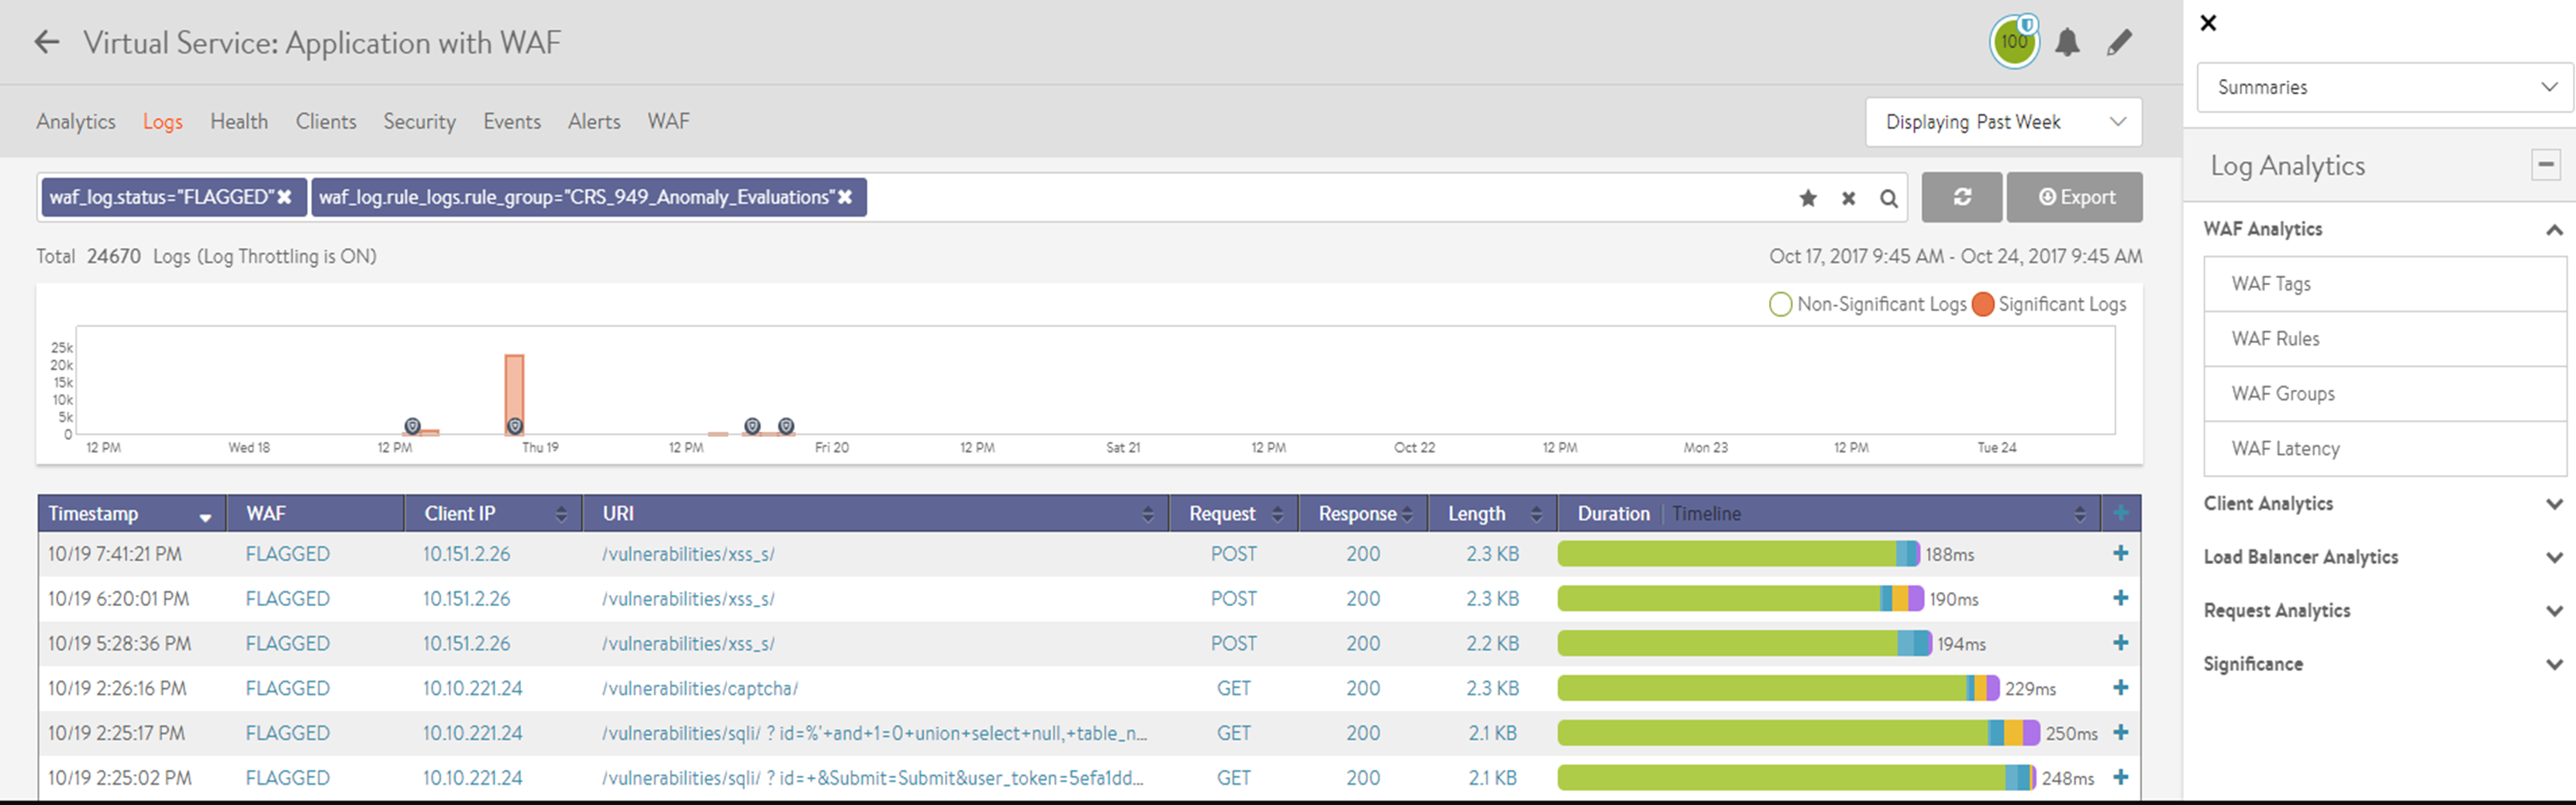
The following screenshot shows a sample of logs displayed on choosing FLAGGED WAF status filter along with CRS_949_Anomaly_Evaluations rule group under WAF Groups in the Analytics tab.
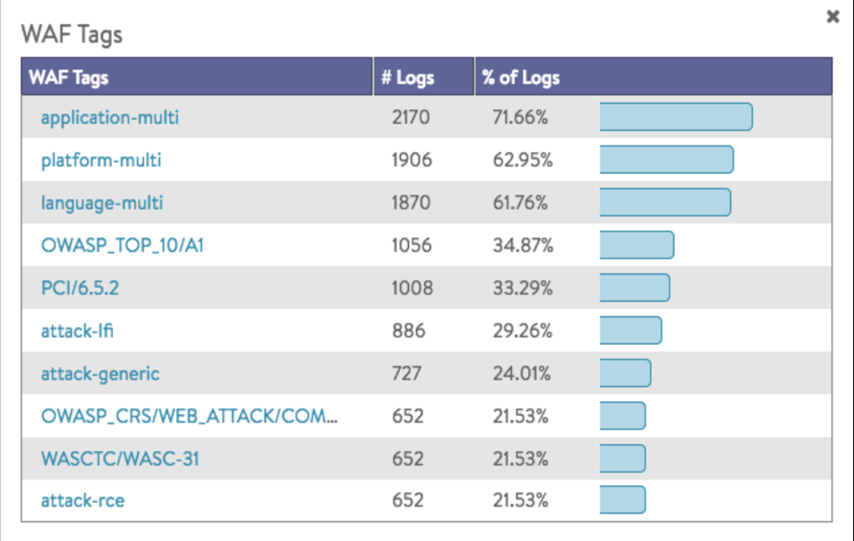
WAF Tags
The following screen capture gives you an overview of the tags that were hit during the selected time frame.
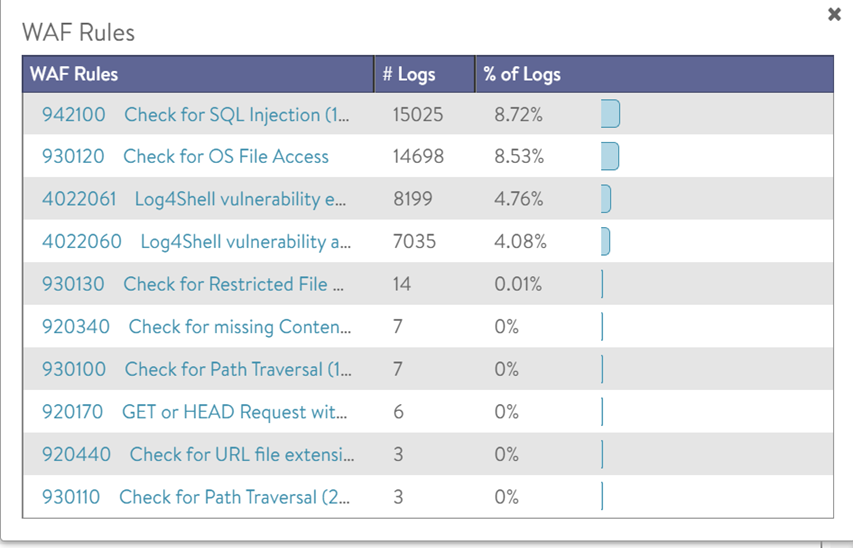
WAF Rules
The following screen capture shows an overview of the rules that were hit during the selected time frame.
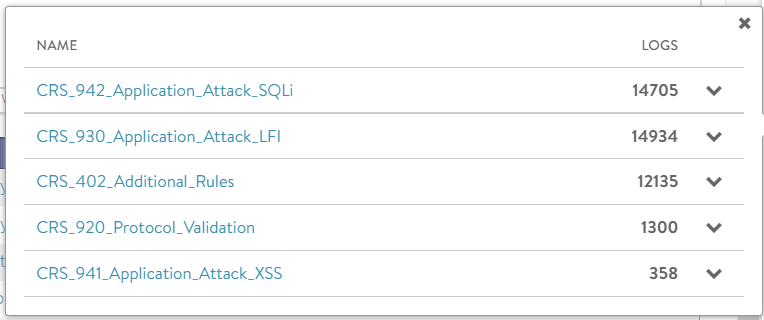
WAF Groups
Check the image below for an overview of the WAF groups that were hit during the selected time frame. Groups can be expanded to show the distribution by rule.
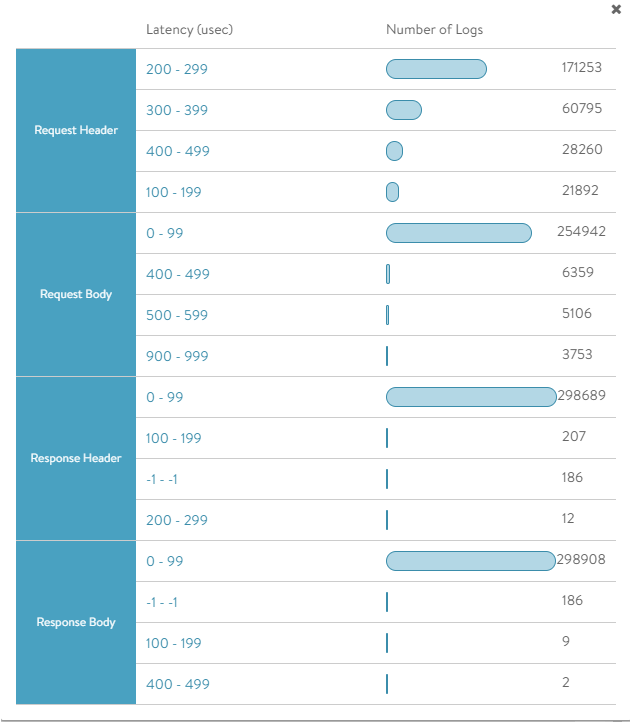
WAF Latency
The following screen captures the summary of WAF latency in microseconds for the log entries in a given time frame.