You can view traffic sessions on virtual machines within the specified time span. The last 24 hours of data is displayed by default, the minimum time span is one hour, and the maximum is two weeks.

Caution:
  • When flow monitoring is enabled, the Dashboard shows a small yellow warning icon to indicate that the feature is turned on. Flow monitoring impacts performance and you must preferably turn it off after monitoring the flow data.
  • A critical alarm is displayed when the flow monitoring count exceeds a predefined maximum count (threshold value). This critical alarm does not impact your environment, and you can safely ignore the alarm. In NSX 6.4.4 and earlier, the maximum flow monitoring count is set to 2 million. Starting in NSX 6.4.5, the maximum flow monitoring count is increased to 5 million.

Prerequisites

Flow monitoring data is only available for virtual machines in clusters that have the network virtualization components installed and firewall enabled. See the NSX Data Center for vSphere Installation Guide.
Procedure

  1. In the vSphere Web Client, navigate to Networking & Security > Tools > Flow Monitoring.
  2. Ensure that you are in the Dashboard tab.
  3. Click Flow Monitoring.

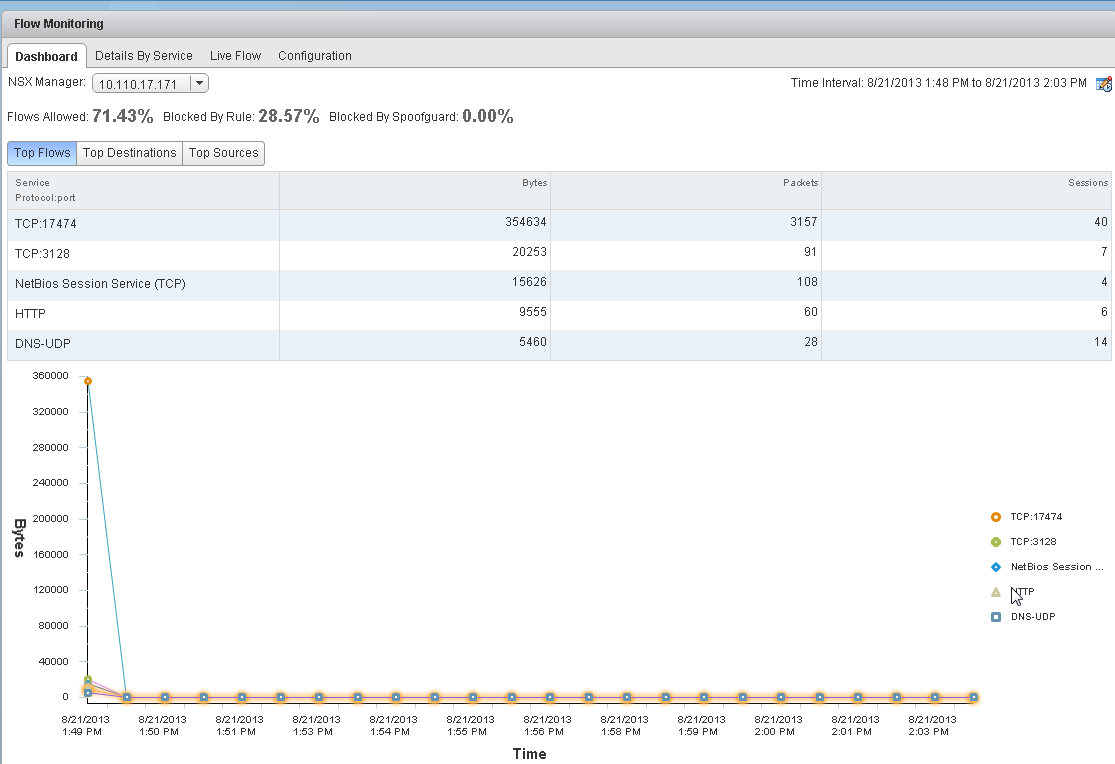
    The page might take several seconds to load. The top of the page displays the percentage of allowed traffic, traffic blocked by firewall rules, and traffic blocked by SpoofGuard. The multiple line graph displays data flow for each service in your environment. When you point to a service in the legend area, the plot for that service is highlighted. flow

    Traffic statistics are displayed in three tabs:
    • Top Flows displays the total incoming and outgoing traffic per service over the specified time period based on the total bytes value (not based on sessions/packets). The top five services are displayed. Blocked flows are not considered when calculating top flows.
    • Top Destinations displays incoming traffic per destination over the specified time period. The top five destinations are displayed.
    • Top Sources displays outgoing traffic per source over the specified time period. The top five sources are displayed.
  4. Click the Details by Service tab.
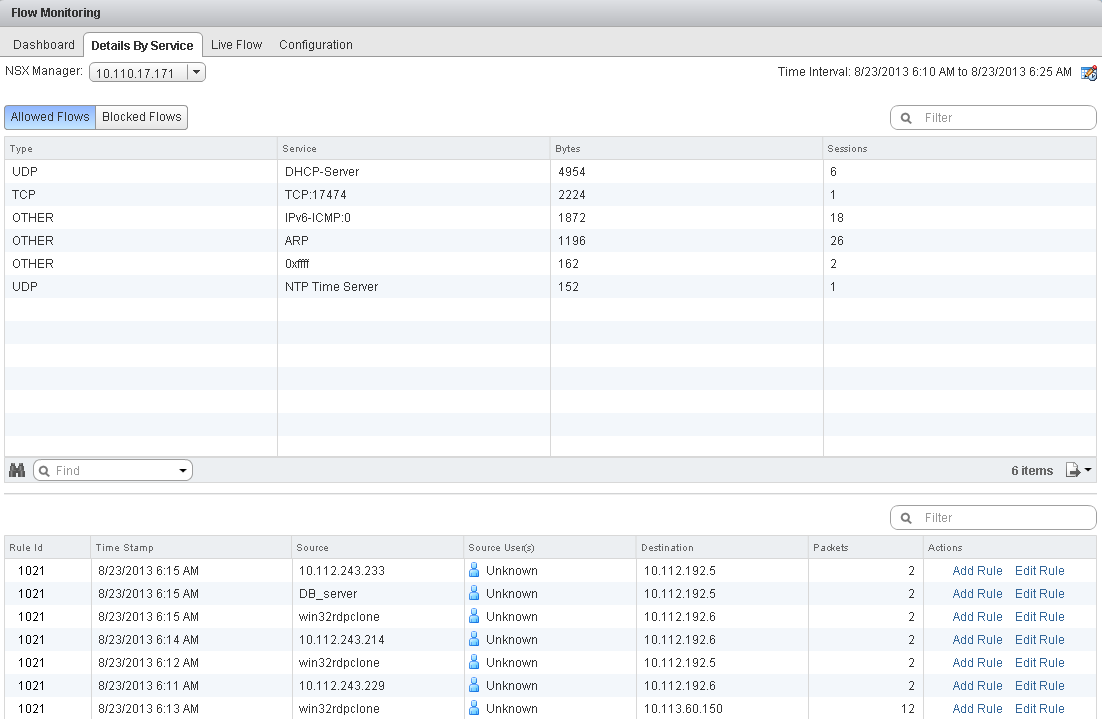
    Details about all traffic for the selected service is displayed. The Allowed Flows tab displays the allowed traffic sessions and the Blocked Flows tab displays the blocked traffic.

    You can search on service names. detailed

  5. Click an item in the table to display the rules that allowed or blocked that traffic flow.
  6. Click the Rule Id for a rule to display the rule details.