NSX Controllers are deployed by NSX Manager in OVA format. Having a controller cluster provides high availability. Deploying controllers requires that NSX Manager, vCenter Server, and ESXi hosts have DNS and NTP configured. A static IP pool must be used to assign IP addresses to each controller.
It is recommended that you implement DRS anti-affinity rules to keep NSX Controllers on separate hosts. You must deploy THREE NSX Controllers.
Common Issues with Controllers
During the deployment of NSX Controllers, the typical issues that can be encountered are as follows:
- Deployment of NSX Controller(s) fails.
- NSX Controller fails to join the cluster.
- Running the show control-cluster status command shows the Majority status flapping between Connected to cluster majority to Interrupted connection to cluster majority.
- NSX Dashboard displaying issue with the connectivity status.
- The show control-cluster status command is the recommended command to view whether a controller has joined a control cluster. You need to run this on each controller to find out the overall cluster status.
controller # show control-cluster status
Type                Status                                       Since
--------------------------------------------------------------------------------
Join status:        Join complete                                10/17 18:16:58
Majority status:    Connected to cluster majority                10/17 18:16:46
Restart status:     This controller can be safely restarted      10/17 18:16:51
Cluster ID:         af2e9dec-19b9-4530-8e68-944188584268
Node UUID:          af2e9dec-19b9-4530-8e68-944188584268
Role                Configured status   Active status
--------------------------------------------------------------------------------
api_provider        enabled             activated
persistence_server  enabled             activated
switch_manager      enabled             activated
logical_manager     enabled             activated
dht_node            enabled             activated
Note: When you see controller node is disconnected, do NOT use join cluster or force join command. This command is not designed to join node to cluster. Doing this, cluster might enter in to a totally uncertain state.Cluster startup nodes are just a hint to the cluster members on where to look when the members start up. Do not be alarmed if this list contains cluster members no longer in service. This will not impact cluster functionality.
All cluster members should have the same cluster ID. If they do not, then the cluster is in a broken status and you should work with VMware technical support to repair it.
- The show control-cluster startup-nodes command was not designed to display all nodes currently in the cluster. Instead, it shows which other controller nodes are used by this node to bootstrap membership into the cluster when the controller process restarts. Accordingly, the command output may show some nodes which are shut down or have otherwise been pruned from the cluster.
- In addition, the show control-cluster network ipsec status command allows to inspect the Internet Protocol Security (IPsec) state. If you see that controllers are unable to communicate between themselves for a few minutes to hours, run the cat /var/log/syslog | egrep "sending DPD request|IKE_SA" command and see if the log messages indicate absence of traffic. You can also run the ipsec statusall | egrep "bytes_i|bytes_o" command and verify that there are no two IPsec tunnels established. Provide the output of these commands and the controller logs when reporting a suspected control cluster issue to your VMware technical support representative.
- The show control-cluster status command is the recommended command to view whether a controller has joined a control cluster. You need to run this on each controller to find out the overall cluster status.
- IP connectivity issues between the NSX Manager and the NSX controllers. This is generally caused by physical network connectivity issues or a firewall blocking communication.
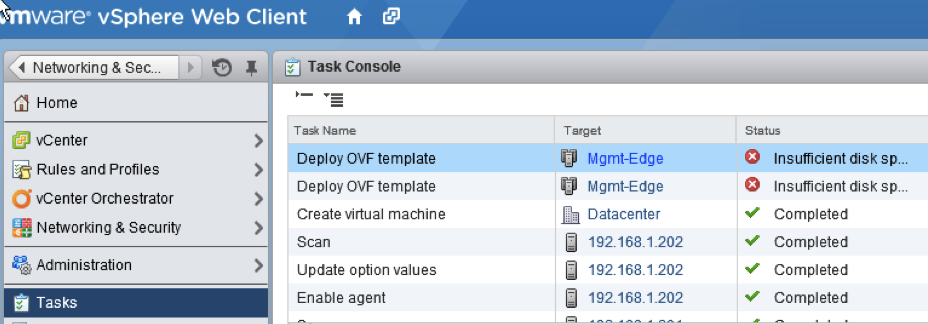
- Insufficient resources such as storage available on vSphere to host the controllers. Viewing the vCenter events and tasks log during controller deployment can identify such issues.

- A misbehaving "rogue" controller or an upgraded controllers in the Disconnected state.
- DNS on ESXi hosts and NSX Manager have not been configured properly.
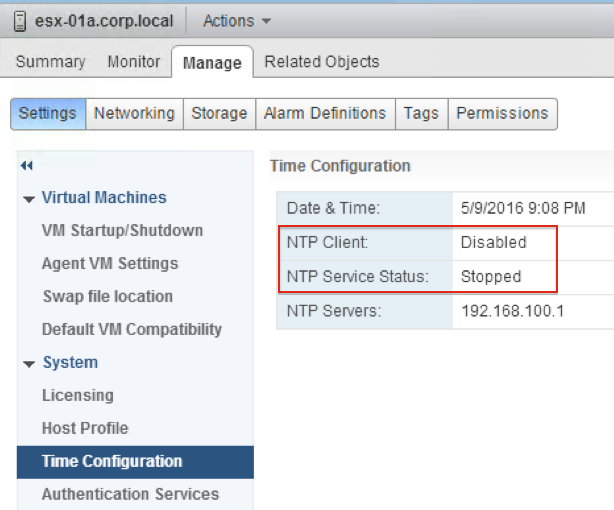
- NTP on ESXi hosts and NSX Manager are not in sync.

- When newly connected VMs have no network access, this is likely caused by a control-plane issue. Check the controller status.
Also try running the esxcli network vswitch dvs vmware vxlan network list --vds-name <name> command on ESXi hosts to check the control-plane status. Note that the Controller connection is down.

- Running the show log manager follow NSX Manager CLI command can identify any other reasons for a failure to deploy controllers.

Host Connectivity Issues
- Check for any abnormal error statistics using the show log cloudnet/cloudnet_java-vnet-controller*.log filtered-by host_IP command.
- Verify the logical switch/router message statistics or high message rate using the following commands:
- show control-cluster core stats: overall stats
- show control-cluster core stats-sample: latest stats samples
- show control-cluster core connection-stats ip: per connection stats
- show control-cluster logical-switches stats
- show control-cluster logical-routers stats
- show control-cluster logical-switches stats-sample
- show control-cluster logical-routers stats-sample
- show control-cluster logical-switches vni-stats vni
- show control-cluster logical-switches vni-stats-sample vni
- show control-cluster logical-switches connection-stats ip
- show control-cluster logical-routers connection-stats ip
-
You can use the show host hostID health-status command to check the health status of hosts in your prepared clusters. For controller troubleshooting, the following health checks are supported:
- Check whether the net-config-by-vsm.xml is synchronized to controller list.
- Check if there is a socket connection to controller.
- Check whether the VXLAN Network Identifier (VNI) is created and whether the configuration is correct.
- Check VNI connects to master controllers (if control plane is enabled).
Installation and Deployment Issues
- Verify that there are at least three controller nodes deployed in a cluster. VMware recommends to leverage the native vSphere anti-affinity rules to avoid deploying more than one controller node on the same ESXi host.
- Verify that all NSX Controllers display a Connected status. If any of the controller nodes display a Disconnected status, ensure that the following information is consistent by running the show control-cluster status command on all controller nodes:
| Type | Status |
|---|---|
| Join status | Join complete |
| Majority status | Connected to cluster majority |
| Cluster ID | Same information on all controller nodes |
- Ensure that all roles are consistent on all controller nodes:
Role Configured status Active status api_provider enabled activated persistence_server enabled activated switch_manager enabled activated logical_manager enabled activated directory_server enabled activated -
Verify that
vnet-controllerprocess is running. Run the show process command on all controller nodes and ensure thatjava-dir-serverservice is running. - Verify the cluster history and ensure there is no sign of host connection flapping, or VNI join failures and abnormal cluster membership change. To verify this, run the show control-cluster history command. The commands also shows if the node is frequently restarted. Verify that there are not many log files with zero (0) size and with different process IDs.
- Verify that VXLAN Network Identifier (VNI) is configured. For more information, see the VXLAN Preparation Steps section of the VMware VXLAN Deployment Guide.
- Verify that SSL is enabled on the controller cluster. Run the show log cloudnet/cloudnet_java-vnet-controller*.log filtered-by sslEnabled command on each of the controller nodes.