


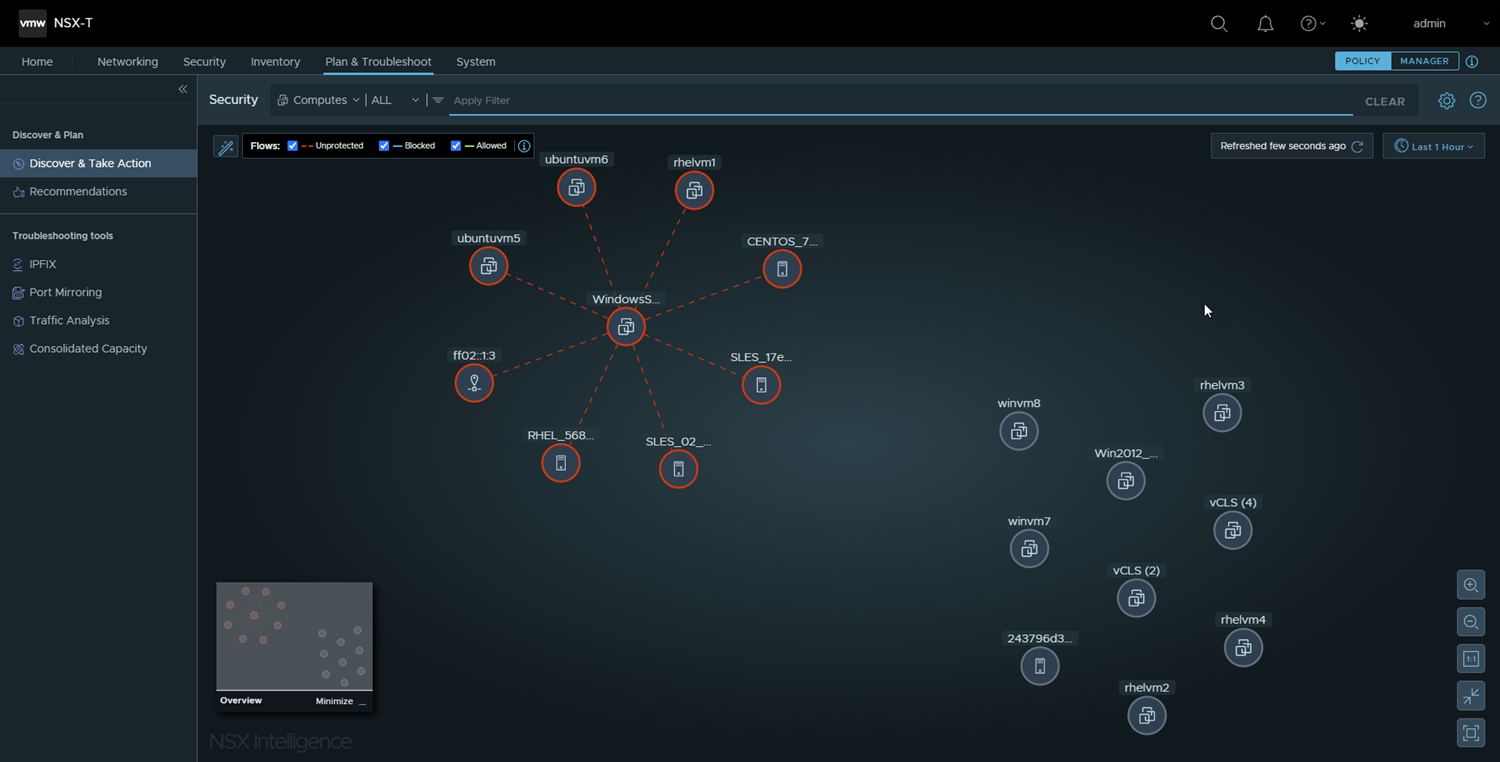
A node in the Computes view represents one of the compute entities in your on-premises NSX-T Data Center environment. A compute entity is either a virtual machine (VM), a physical server, or an IP address.
View Selection
If you are not seeing the Computes view, click the down arrow next to Groups in the Security view selection area and select Computes. In the drop-down menu, you can select Select All Computes to display all the compute entities during the selected time period. To display only VMs, IPs, or Physical Servers, click Show All Types and select VMs, IPs, or Physical Servers from the drop-down menu.
You can also select specific compute entities from the Available Items list. Use the Search text box to filter the selection list. Click Apply after making your selections.
If you click away from the drop-down menu without making any selection or if you select Select All Computes in the drop-down menu, the Select All Computes option is applied to the Computes view.
Nodes in the Computes View
Type of Compute Entity Node |
Icon |
Description |
|---|---|---|
Regular VM |

|
A Regular VM node represents a virtual machine (VM) that is part of your NSX-T Data Center environment. A VM can belong to more than one group. |
Public IP |

|
A Public IP node represents a public IP address, either an IPv4 or IPv6 , that is communicating to or from your NSX-T Data Center environment. Right-clicking this icon lists all the public IP addresses that had network traffic activity during the selected time period. Pointing on a traffic flow arrow connected to this node displays the actual IP address that participated in that traffic flow exchange. |
IP |

|
An IP node represents an IP address that participated in the network traffic activities during the selected time period. An IP address can be a unicast, broadcast, or multicast IP address. |
Physical Server |

|
This node represents a physical server that is part of your NSX-T Data Center environment. A physical server can belong to more than one group. The currently supported physical servers are as follows.
|
Node Color
The color of a compute entity node's border indicates the type of traffic flows that have occurred with the compute entity during the selected time period.
A node with a red-hued border indicates that at least one unprotected traffic flow was detected, regardless of the number of blocked or allowed flows that were detected during the selected time period.
A blue-hued border on a node means that no unprotected traffic flows were detected, but at least one blocked flow was detected, regardless of how many allowed flows were detected during the selected time period.
A node with a green-hued border indicates that there were no unprotected or blocked flows detected during the selected time period, and at least one allowed flow was detected.
A node with a gray-hued border means that during the selected time period there were no traffic flows detected for that compute entity.
Arrows in the Computes View
The arrows between the compute entity nodes represent the traffic flows that have occurred between the compute entities during the selected time period. See Working with Traffic Flows for more information.
Clusters of Compute Entity Nodes
If 100 or more compute entity nodes and 1,000 or more traffic flows must be displayed, the NSX Intelligence graph displays the compute entity nodes into clusters. These clusters of compute entities are based on the connectivity between the compute entities during the selected time period. Clustering the compute entities allows you to have a high-level view of the network traffic activities for your entire NSX-T Data Center environment during that selected time period.
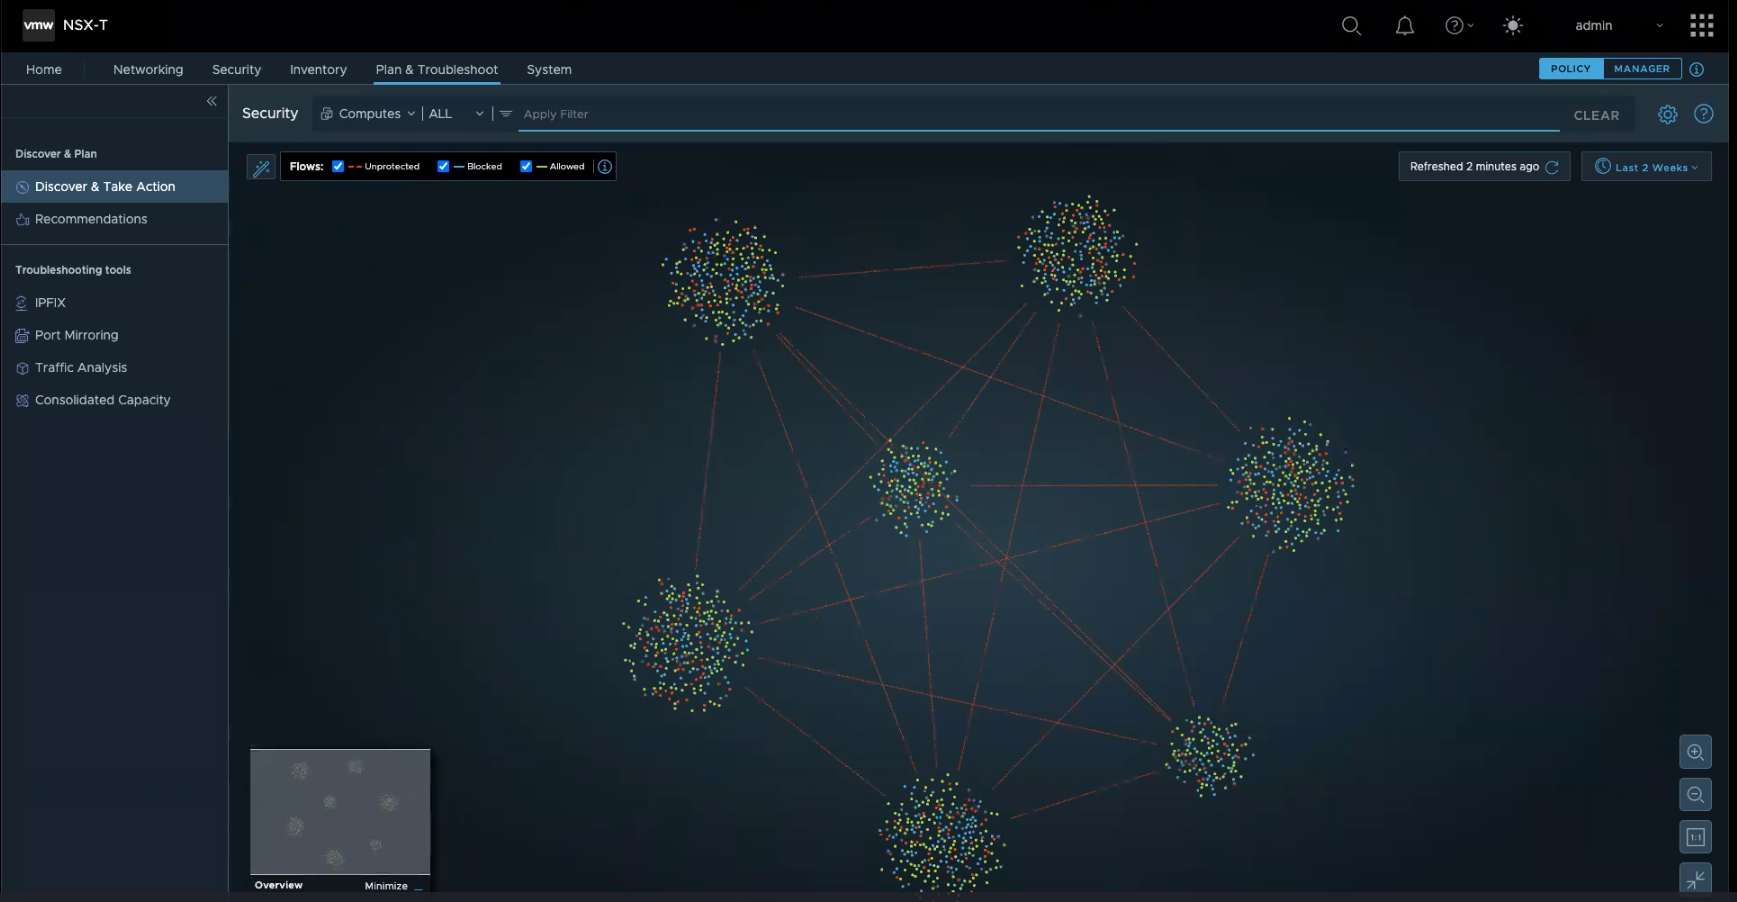
Pointing to a specific cluster displays a number above the cluster area. This number indicates how many compute entities there are in that particular cluster visualization. To view more details about a specific cluster and the compute entities that are part of that cluster, zoom in the graph. As you zoom in closer to the nodes and arrows, the details about the compute entities and traffic flows become more visible and easier to select. You can also apply filters to narrow the compute entities that are displayed in the visualization graph.
Node Selection in Computes View
When you click a compute entity node, a dashed circle marks the selection as a pinned compute entity node. Other compute entity nodes that had traffic flows with that pinned node are also made more prominent in the Computes view. All other nodes become dimmed to make them less visible. To clear the pinned selection, click in any empty area of the Computes view.
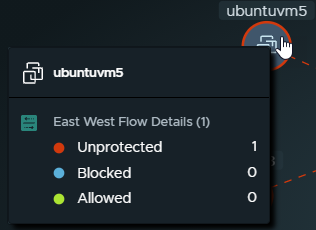
When you zoom out of the Computes view and the details in the compute entity nodes are no longer visible, point to any visible part of the node. The details for the compute entity are displayed.
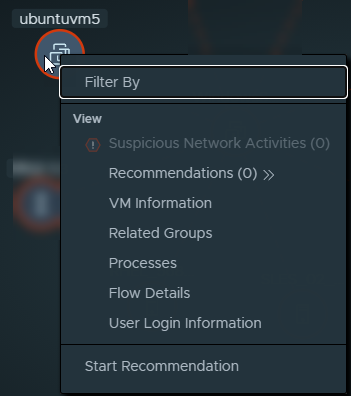
Available Actions in the Computes View
Selection |
Description |
|---|---|
Filter By |
The compute entity is added to the visualization filter that is used for the current Computes view. |
Suspicious Network Activities <n> |
If suspicious network activity is detected involving this compute entity, this item will be selectable. The (n) indicates the number of detected suspicious activities. See Detecting Suspicious Network Traffic in NSX-T Data Center for more information. |
Recommendations (<n>) |
The table of recommendations for the current compute entity is displayed. The (n) indicates the number of available recommendations. From the Recommendations table, you can view the recommendation details and perform the available actions. See Working with NSX Intelligence Recommendations for more information. |
<Compute entity type> Information |
The details are displayed for the currently selected compute entity during the selected time period. Details depend on the type and can include the Name, IP Address, ID, operating system info, and many more.
Note:
If a VM is attached to the segment profile as the default IP Discovery profile and has (Trust On First Use) TOFU enabled, the VM initially gets an IP address from DHCP. If the DHCP IP address is released and the VM's IP address is changed to a static IP address, both the DHCP and static IP addresses are displayed in VM Information. If TOFU was disabled in the default IP discovery profile, when the initially assigned DHCP IP address is released and the VM's IP address is changed to a static address, only the static IP address is displayed in VM Information. |
Related Groups |
Displays the Groups table with information about groups to which the compute entity belonged during the selected time period. |
Processes |
(For VM nodes only) Displays the Processes table which displays the details about the processes that involved traffic flows where data was either sent, received, or both to the VM. |
Flow Details |
Shows the details about the completed flows and the flows that are currently active with the compute entity during the selected time period.
Note:
The active flows during the selected time period are more than 2.5 minutes old at the time the details are displayed. The details include the following.
You can click some of the details to obtain more information. See Working with Traffic Flows for more information. |
User Login Information |
(For VM nodes only) Shows user login information for the selected VM. |
Start Recommendation |
Displays the Start New Recommendations wizard. See Working with NSX Intelligence Recommendations for more details. |
