


As the NSX Suspicious Traffic feature generates network threat analytics on the collected network traffic flow data, it reports about suspicious events it detected using the Detection Events page. You can view the detection events in either a bubble chart, a grid, or both.
Prerequisites
- NSX Intelligence 3.2 or later must be activated and the NSX Suspicious Traffic detectors must be turned on. See Getting Started with Detecting Suspicious Network Traffic in NSX.
- You must be logged in to NSX Manager using one of the following NSX roles.
- Enterprise Admin
- Security Admin
Managing Detection Events
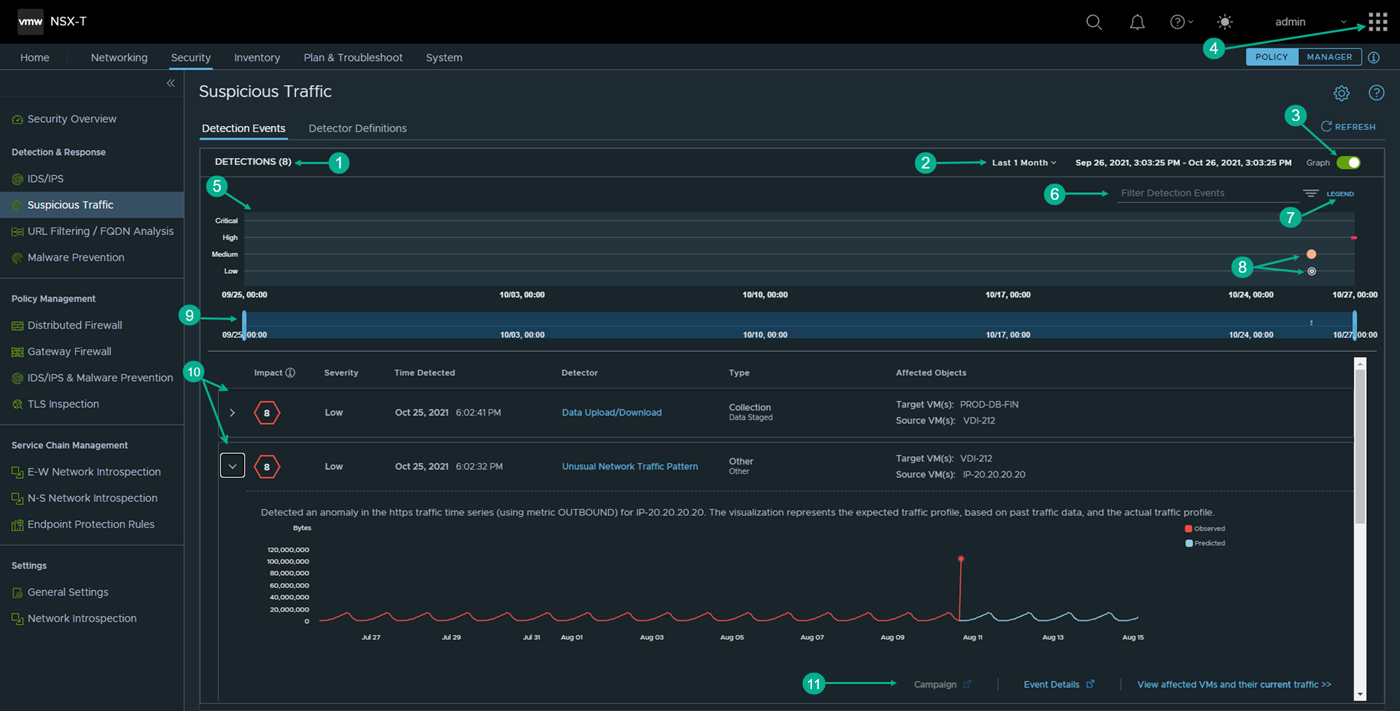
By default, when you navigate to , you see the detection events displayed in both the bubble chart and grid formats, as shown in the following image. The table that follows the image describes the numbered sections highlighted in the image.
Section |
Description |
|---|---|
1 |
Gives the total number of suspicious event detections that the NSX Suspicious Traffic feature made during the selected time period. |
2 |
In this section, you select the time period that the system uses to determine which historical data about the detected events are reported by NSX Suspicious Traffic on this UI page. The time period is relative to the current time and some time period in the past. The default time period is Last 1 hour. To change the selected time period, click the current selection and select another from the drop-down menu. The available selections are Last 1 Hour, Last 12 Hours, Last 24 Hours, Last 1 Week, Last 2 Weeks, and Last 1 Month. |
3 |
The Graph toggle determines if the bubble chart is displayed or not. When the Graph toggle is turned off, only the grid displays information about the detection events. By default, it is toggled to On. |
4 |
If the NSX Network Detection and Response feature is activated, when you are viewing the NSX Suspicious Traffic user interface, the application launcher icon To view more details about the detected anomalous events using the NSX Network Detection and Response UI, click the |
5 |
This bubble chart provides a visual timeline of when the detected events occurred during the selected time period. Each event is plotted based on the severity of the detection event. The following are the severity categories and their corresponding severity scores.
|
6 |
The filter area enables you to narrow down the detection events that are displayed for the selected time period. Click Filter Detection Events and select from the drop-down menu the filters you want applied and specific items in the additional drop-down menu that is displayed. The available filters include the following.
|
7 |
Click Legend to list the different types of bubbles that can appear in the bubble chart. The following list describes each bubble and the type of detection event it represents.
|
8 |
Each bubble in the chart represents a detection event or multiple events that occurred during the selected time period. The color or type of bubble represents the tactic used by the adversary during the detected attack. See the descriptions in Legend for more information. |
9 |
The time window slider allows you to view detection events that occurred within a subset of the selected time period. The highlighted blue area represents what is displayed in the bubble chart. As you slide the slider to the right or left, the bubble chart gets updated with the detection events that occurred during the period highlighted in the slider. If there are detection events that occurred around the same time, a Multiple Events bubble represents those detection events. When you move the slider to the right, you will notice that the Multiple Events bubble expands into the multiple bubbles that represent the different detection events that occurred around that time period. |
10 |
The grid displays information about each detection event that the NSX Suspicious Traffic feature identified during the selected time period. When not expanded, a row shows the following key event data.
The example screenshot also shows an expanded row. When expanded, a row displays additional event information. The details include a summary of the event that was detected and an explanation for the visualization or additional event data displayed in the expanded row. For example, in the above screenshot, the expanded row displays a summary of the detected event and what the visualization represents. Not all the detection events will have visualization. Others only have additional detailed data. |
11 |
An expanded row might also display one or more links in the bottom-right corner. When clicked, a link takes your view to another UI page where more information about the detected event is provided. The following are the available links, when applicable for the detection event. The following link might be enabled, even if the NSX Network Detection and Response feature is not activated.
If the NSX Network Detection and Response application is activated, the following links might also be available if applicable for the event.
|
 is visible in the upper-right corner of the UI.