


After the generated NSX Intelligence recommendation reaches the Ready to Publish status, you can review the recommendation, modify it if necessary, and decide whether to publish it.
Prerequisites
Generate a new recommendation. See Generate a New NSX Intelligence Recommendation.
Ensure that you have the required privileges before publishing the recommendations. See Role-Based Access Control in NSX Intelligence for more information.
Procedure
- (Optional) If you decide not to use the generated recommendation, click
 and select Delete.
 - To begin reviewing and managing the details of the recommendation that has the status of Ready To Publish, click the Recommendation name's link, or click and select Review & Publish.
The Recommendations wizard is displayed, similar to the following image. In the Review Recommendations pane, the details for the recommendations are displayed in a split view. The top half of the pane shows a visualization of the recommendations in a graphical format. The bottom half of the pane lists the recommendations in a tabular format.
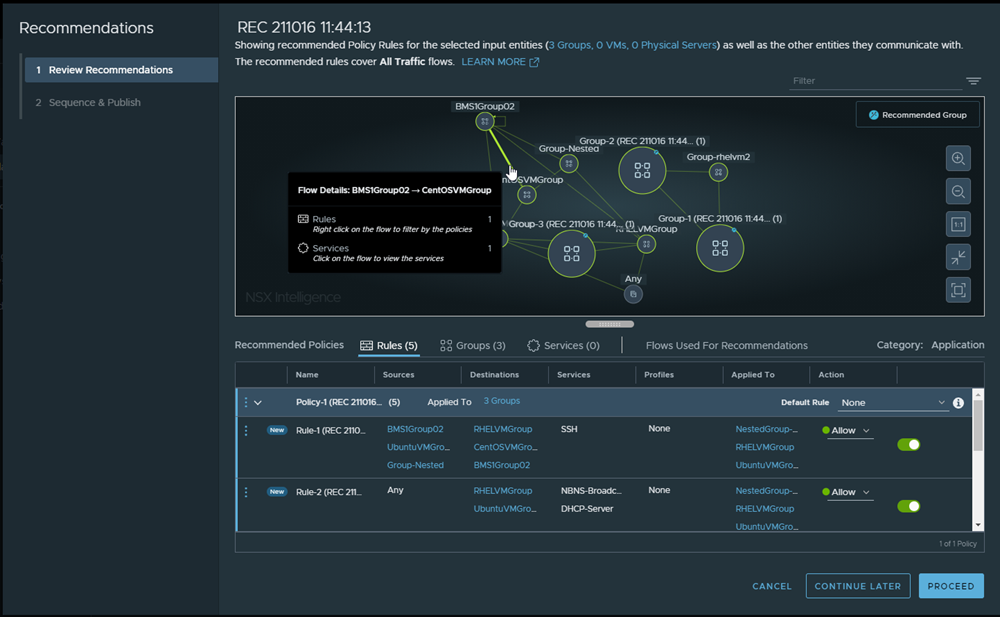
- Use the top half of the pane to examine the graphical visualization of the recommendations.
You can click specific nodes and flow arrows to see the details for the recommendations. You can point to the flow arrow between two group nodes to see which policy rules have been applied between groups or what services have been created. Right-click the flow arrow to filter the recommendation by the corresponding policy rules.
Nodes with the recommendation icon
 on the edge indicate that the node represents a recommended group. You can right-click the node for a group recommendation, rename the group, or edit the compute entity members that belong in that group. You can also right-click a group node to rename it, view or edit its members, or select Filter By to use the current group as the filter used to display details about the generated recommendation.
Changes made using the graphical view of the recommendations are reflected in the table in the bottom half of the pane. Similarly, changes made to the recommendations info in the table are reflected in the graphical visualization.
- In the bottom half of the Review Recommendations pane, you can use the tabular view of the recommendations to see the details about the rules, groups, and services that are included in the recommendation. Use the Flows Used for Recommendations tab to see the unprotected traffic flows that were used to generate the recommendations.
You can examine and modify any of the recommendation details, by clicking the Rules, Groups, or Services tab.
In the Recommended Policies section, there are numbers displayed on the Rules, Groups, and Services tabs. These numbers indicate the number of new rules, groups, and services that are being recommended. They did not exist in the NSX inventory at the time the recommendations were generated. For example, in the screenshot above, the recommendation Services tab shows zero services being recommended. The services used by the groups existed in the NSX inventory at the time the recommendation was generated. So, there are no new services being recommended.
Any changes that get applied to the rules in the Rules tab (such as adding, deleting, or editing a rule or section get reflected immediately in both the Rules table and in the graphical visualization pane. In the Rules table, rules that have the New badge to the left of its name indicates that the rule is a newly generated rule, instead of an already existing DFW rule associated with the selected entities. If an existing rule was used, but there were no changes made to it, the row for the rule appears dimmed. If the Recommendation engine modified an existing rule, the row for that rule does not appear dimmed and it does not have the New badge next to it.
- To edit the details in the Sources, Destinations, or Applied To columns, point in the corresponding column and click the edit icon
 .
.
In the resulting dialog box (for example, Set Source Groups), review the newly recommended groups or existing groups that the recommendation engine generated. If you add or remove groups, click Save.
- If you want to rename a recommended group, click the link for the group name in either the Rules tab or the Groups tab. In the Group Detail dialog box, click Group Definition, and in the Name text box, type a new name for the recommended group. Click Save.
- To define how the packets are to be handled when hitting the DFW rule, select Allow, Drop, or Reject in the Action column.
- To activate or deactivate the DFW rule, toggle the button on the right-side of the Action column. By default the rule that was generated is set to Activated when the recommendation was published.
- To review the details about the groups in the recommendation, click the Groups tab.
Before you delete a group, make sure that there are no rules using the group.
- Click the link in the Members column to review the details about the VMs, IPs, and physical servers that were set for the group recommendation.
- Click next to the group's name and select Edit to modify the group recommendation.
- Click the Services tab and review the details.
- Click next to the service's name and select Edit to modify the name or description.
Before you delete a service, make sure that there are no rules using the service.
- To edit the details in the Sources, Destinations, or Applied To columns, point in the corresponding column and click the edit icon
- In the Sequence & Publish pane, define the order in which the newly recommended security policies are to be applied in relation to the existing DFW rules.
Note:
If you selected to reuse a firewall section, you cannot move and reorder the recommended policy. You can only reorder new recommended policies.
- Select the row for the new security policy recommendation.
- Click the Actions menu icon on the leftmost side of the row for the newly recommended security policies listed.
- To move the selected row for the newly recommended security policy to a location above or below the row for the existing security policy, select Move selected policies above this policy or Move selected policies below this policy from the displayed menu.
Alternatively, you can drag the currently selected new policy recommendation row up or down to the order location that you want.
Results
After the security policy recommendations have been published successfully, they are in read-only mode in the tab. To view and manage the published rule recommendations, go to .
After you have published the rule recommendations, the visualization continues to display the affected flows between the compute entities as orange-hued arrows (Unprotected Flows) until new flows are generated between the affected compute entities. The visualization only reports traffic flows based on the time when they occurred on the host and does not reflect the rule set published after the traffic flows occurred. After the rule set is published and new traffic flows are generated, the new flows are displayed as green-hued arrows (allowed flows).
