The arrows between group nodes or compute entity nodes represent the network traffic flows that have occurred between the compute entities during the selected time period.
Network traffic flows are based on the L3 distributed firewall (DFW) rules that are in place and the traffic flows that occurred during the selected time period. All network traffic flows that matched a stateful L3 DFW rule using IPv4 or IPv6 with TCP, UDP, GRE, ESP, and SCTP protocols are included in the visualization details and flow details. TCP flows and UDP flows have the IP and port level details and others have the IP level details only.
Flow Type |
Graphic |
Description |
|---|---|---|
Unprotected |
 |
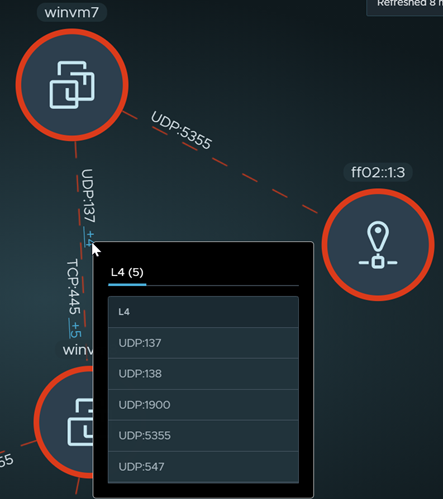
A dashed red-hued arrow indicates that the NSX Intelligence detected that the traffic flow encountered a rule (Source: Any | Destination: Any | Action: Allow or Reject or Drop) and that more granular security policies are needed. This rule can be your default rule, or it can reside anywhere in the East-West distributed firewall. |
Blocked |
 |
A solid blue-hued arrow indicates that NSX Intelligence detected that the traffic flow encountered a 'Reject' or 'Drop' rule that is more granular than the one mentioned in the 'Unprotected' flow definition. |
Allowed |
 |
A solid green-hued arrow indicates that NSX Intelligence detected that the traffic flow encountered an 'Allow' rule that is more granular than the one mentioned in the 'Unprotected' flow definition. |
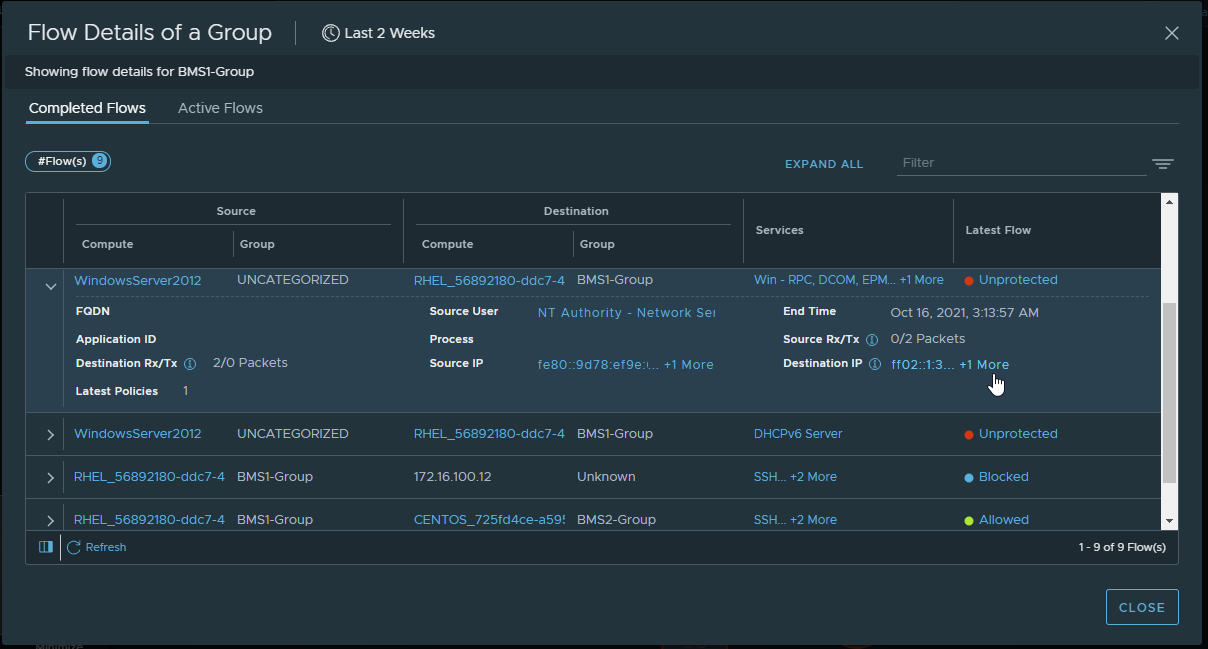
- The source and destination information for the flow.
- The groups the flows belong to, if known.
- Services that were used.
- The type of the latest flow.
When you expand a row, additional information is presented, such as any Layer 7 (L7) application ID and FQDN information; when the flow ended; the total count of Receive/Transmit packets from the source and destination; and the source and destination IP addresses. You can click the detail links provided in the table to obtain more information. For example, if Public IPs participated in a flow, you can click on the Public IPs link to see the actual IP addresses of those public IPs.
To focus only on compute entities with certain types of traffic flows, use the Security view selection area to select the view type, and use the filter attribute to narrow down your selection.
If you deselect a flow type from the Flows section, the lines for that flow type are hidden from the displayed visualization graph. Unless filters are in effect that exclude certain objects, all group or compute entities remain displayed regardless of the traffic flow types that have occurred with those entities during the selected time period. For example, if you deselect the Allowed flow type, all the Allowed flow lines are hidden in the graph. However, all NSX objects are still displayed, even those NSX objects that only had Allowed traffic flows during the selected time period.
The direction of a flow arrow indicates the source and destination of the detected traffic flow. When in Groups view, a self-referencing arrow on a group node indicates that at least one compute entity was communicating with another compute entity within that same group. In a Computes view, a self-referencing arrow indicates that an NSX object in the compute entity communicated with another NSX object in the same compute entity.
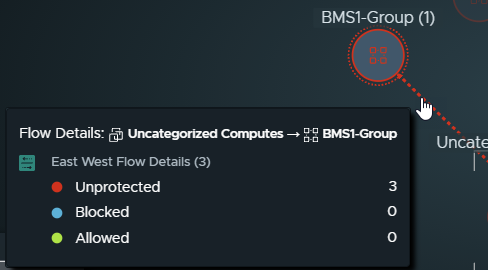
When you click a flow arrow, the Flow Details between Groups dialog box is displayed. It shows the details about the completed and active flows that occurred during the selected time period. To get more detailed information about the source and destination of the flow, the type of service, and the type of flow, click the links provided in the table.