


A node in the Computes view represents one of the compute entities in your on-premises NSX environment. A compute entity is a virtual machine (VM), a physical server, or an IP address.
Computes View Selection
If you are not seeing the Computes view, click the down arrow next to Groups in the Security view selection area and select Computes from the Objects drop-down menu. To display all the compute entities during the selected time period, you can click Apply in the drop-down menu or click any blank space in the canvas area.
To display only VMs, IPs, or Physical Servers, click Show All Types and select VMs, IPs, or Physical Servers from the drop-down menu. The default selection is All.
You can also select specific compute entities from the Available list. Use the Search text box to filter the selection list. You can deselect any selected items or to cancel all your previous selections, click Clear All.
Select Exclude if you do not want to include in the visualization graph the compute entities listed in the Selection section. By default, the selected compute entities are included in the displayed graph. Click Apply after making your selections.
Clustering of Compute Nodes
By default, when you select the Computes view and if there are less than 500 compute nodes or less than 5000 network traffic flows to be displayed, the compute entity nodes are displayed using the No Clustering mode. If those limits are exceeded, the Clustering By Flows mode is the default clustering mode used. These clustering modes are based on the traffic flows that occurred with the compute entities in your NSX environment when there are 30 days worth of traffic flow data. Using the clustering feature, you can have a high-level view of the activities in your NSX environment during the selected time period and can help you decide where to focus your attention.
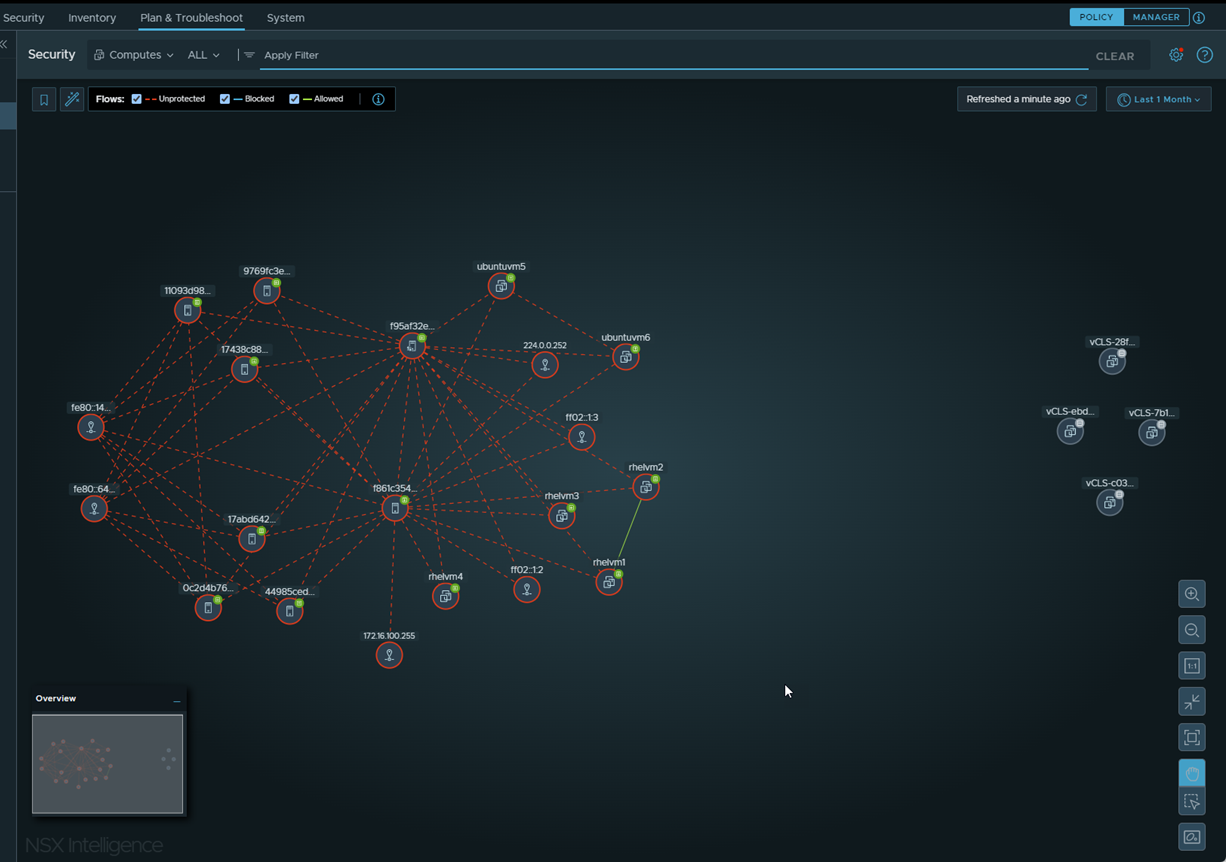
As you zoom in closer to the nodes and arrows, the details about the compute entities and traffic flows become more visible and easier to select. To narrow which compute entities are displayed in the visualization graph, apply filters using the Apply Filter section.
To change the clustering mode used for the visualization, click the clustering control icon  located at the bottom right of the visualization graph and select Flows, Labels, Names, or Tags. The visualization graph gets updated immediately based on your clustering mode selection.
Nodes in the Computes View
A node in the Computes view represents a compute entity (VM, a physical server, or an IP address) or an uncategorized VM in your NSX environment. Any node that is communicating with one of the compute entities in your NSX environment, but did not get identified as part of the NSX inventory, is also represented in the Computes view.
Type of compute entity node |
Icon |
Description |
|---|---|---|
Regular VM |

|
A Regular VM node represents a virtual machine (VM) that is part of your NSX environment. A VM can belong to more than one group. |
Public IP |

|
A Public IP node represents a public IP address, either an IPv4 or IPv6, that is communicating to or from your NSX environment. Right-clicking this icon lists all the public IP addresses that had network traffic activity during the selected time period. Pointing on a traffic flow arrow connected to this node displays the actual IP address that participated in that traffic flow exchange. |
IP |

|
An IP node represents an IP address that participated in the network traffic activities during the selected time period. An IP address can be a unicast, broadcast, or multicast IP address. |
Physical Server |

|
This node represents a physical server that is part of your NSX environment. A physical server can belong to more than one group. The currently supported physical servers are as follows.
|
Network infrastructure service entity |


|
These nodes represent a VM and a physical server, respectively. They have been classified as providing core network infrastructure services, such as DNS, DHCP, LDAP, or Active Directory. An orange-hued badge on the upper right edge of the icon, as shown in this image |
 , indicates that the system-inferred infrastructure classification for this compute entity needs your review. For more information, see
 Color of a Node
The color of the border of a compute entity node corresponds to the types of traffic flows that occurred with the compute entity during the selected time period. A compute entity that did not have any communication with any other compute entities during the selected time period is also assigned a color. The following table illustrates and describes the different node colors for a VM compute entity.
| Type of Compute Entity Node | Description |
|---|---|

|
A node with a red-hued border indicates that at least one unprotected traffic flow was detected, regardless of the number of blocked or allowed flows that were detected during the selected time period. |

|
A blue-hued border on a node means that no unprotected traffic flows were detected, but at least one blocked flow was detected, regardless of how many allowed flows were detected during the selected time period. |

|
A node with a green-hued border indicates that there were no unprotected or blocked flows detected during the selected time period, and at least one allowed flow was detected. |

|
A node with a gray-hued border means that during the selected time period there were no traffic flows detected for that compute entity. |
Arrows in the Computes View
The arrows between the compute entity nodes represent the traffic flows that have occurred between the compute entities during the selected time period. See Working with Traffic Flows in NSX Intelligence for more information.
Node Selection in Computes View
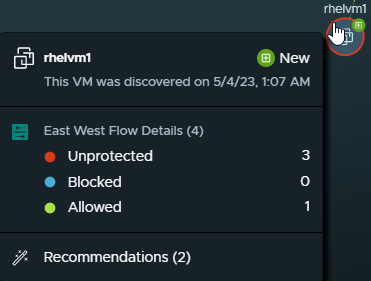
 and the details of when the compute entity got added are also displayed. If it was part of a recommendation analysis, that information is shown in the contextual menu. If the compute entity was deleted, a
Removed badge icon
and the details of when the compute entity got added are also displayed. If it was part of a recommendation analysis, that information is shown in the contextual menu. If the compute entity was deleted, a
Removed badge icon
 is displayed, and information about when it was removed.
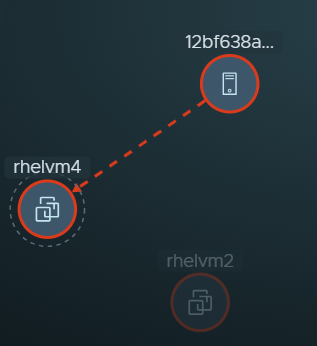
rhelvm4 VM node is selected and becomes the pinned compute entity node. One other compute entity had at least one traffic flow with
rhelvm4 entity during the selected time period, so it is displayed more prominently. All the other compute entities, like
rhelvm2, that did not communicate with
rhelvm4 during the selected time period are dimmed in the view.
When you zoom out of the Computes view and the details in the compute entity nodes are no longer visible, point to any visible part of the node. The details for the compute entity are displayed.
Selecting Multiple Compute Nodes
You can select multiple compute entity nodes and perform the same action, such as assigning a label or a tag, or starting a recommendation analysis, on your selection of compute entities.
Click the selection control icon  to select one or more of the compute entity nodes displayed in the visualization canvas. You can click individual nodes one at a time or drag your pointer over the compute nodes that you want to select. You can also press the Shift+click specific compute nodes to make your selection.
 . Each icon displayed in this panel is described in the following table.
| Selected panel icon | Description |
|---|---|

|
From this panel you can click the recommendation icon and start a new recommendation analysis using the selected compute entities. See Working with NSX Intelligence Recommendations for details. |

|
You can assign a tag to the selected compute entities simultaneously by clicking this tag icon. See Managing VM Tags in NSX Intelligence for more information. |

|
You can also click this label icon and assign a label for the selected compute entities. For more information, see Managing Visualization Labels in NSX Intelligence. |

|
If you want to remove the label assignments to the selected compute entities, click this remove label icon |

|
When you click this icon, the system does not display on the NSX Intelligence visualization canvas all of the traffic flows that occurred involving the selected compute entities during the specified time period. |
Using Labels in the Computes View
You can assign a label to a selection of compute entity nodes. After you make your selection, right-click any of the selected nodes, select Assign a Label, select a label from the drop-down menu of available labels, and click Assign. See Managing Visualization Labels in NSX Intelligence for details.
Available Actions in the Computes View
Selection |
Description |
|---|---|
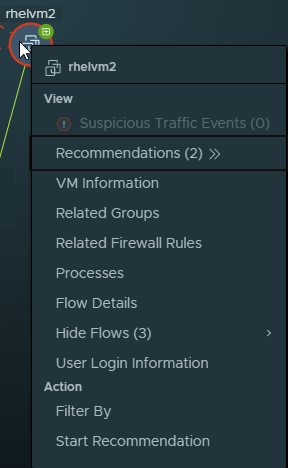
View Suspicious Traffic Events (n) |
If a suspicious traffic event is detected involving this compute entity during the selected time period, this item will be selectable. The (n) indicates the number of detected suspicious traffic events that occurred during that time period. See Detecting Suspicious Traffic Events in NSX for more information. |
View Recommendations (n) |
The system displays a table of DFW recommendations that includes the current compute entity. The (n) indicates the number of available recommendations. From the Recommendations table, you can view the recommendation details and perform the available actions. See Working with NSX Intelligence Recommendations for more information. |
View VM Information |
The details are displayed for the currently selected compute entity during the selected time period. Details depend on the type and can include the Name, IP Address, ID, operating system information, computer name, tags, BIOS ID, host transportation node, and infrastructure classification.
Note:
If a VM is attached to the segment profile as the default IP Discovery profile and has (Trust On First Use) TOFU enabled, the VM initially gets an IP address from DHCP. If the DHCP IP address is released and the VM IP address is changed to a static IP address, both the DHCP and static IP addresses are displayed in VM Information. If TOFU was disabled in the default IP discovery profile, when the initially assigned DHCP IP address is released and the VM IP address is changed to a static address, only the static IP address is displayed in VM Information. |
View Related Groups |
Displays the Groups table with information about groups to which the compute entity belonged during the selected time period. |
View Related Firewall Rules |
Displays the Related Firewall Rules dialog box that lists all of the distributed firewall rules associated with this selected compute entity. See Viewing Related Firewall Rules in NSX Intelligence for more information. |
View Processes |
(For VM nodes only) Displays the Processes table, which displays the details about the processes that involved traffic flows where data was either sent, received, or both to the VM. To be able to view information about the processes, you must install guest components on the VMs. See the "Installing Guest Components" section of the NSX Administration Guide that is delivered with the VMware NSX Documentation set. |
View Flow Details |
Displays the Flow Details dialog box that includes the Completed Flows tab and Active Flows tab. Each tab displays a table of the traffic flows that occurred with the compute entity during the selected time period.
Note:
The active flows during the selected time period are more than 2.5 minutes old at the time the details are displayed. The details include the flow's source and destination compute entity, services that were used, and the type of the latest flow (unprotected, blocked, or allowed). Expand the row for the flow to see more details, such as application ID, FQDN, time the flow ended, and any firewall rules that were in effect. See Working with Traffic Flows in NSX Intelligence for more information. |
Hide Flows (n) |
The lines for the traffic flows that the compute entity participated in are removed from the current security posture visualization. The (n) indicates the number of flow lines that are affected. |
View User Login Information |
(For VM nodes only) Shows user login information for the selected VM. To be able to view user login information, you must install guest components on the VMs. See the "Installing Guest Components" section of the NSX Administration Guide that is delivered with the VMware NSX Documentation set. |
Filter By |
The compute entity gets added to the visualization filter that is used for the current Computes view. The visualization is refreshed when the filter is applied. |
Start Recommendation |
This selection displays the Start New Recommendations wizard. See Working with NSX Intelligence Recommendations for more details. |
The following topics provide information about using NSX Intelligence visualization UI to assign and manage visualization labels compute entities and tags to VMs.
