


When you click on your NSX Manager UI, the system displays the Groups view on the NSX Intelligence visualization canvas. The default Groups view displays all the groups in your NSX environment and the traffic flows that occurred within the last 15 minutes with those groups.
Groups View Selection
If you are not seeing the Groups view, click the down arrow next to the Computes label in the Discover view selection area and select Groups from the Objects drop-down menu. To display all the groups during the selected time period, click Apply in the drop-down menu or click any blank space in the canvas area.
Alternatively, you can select specific groups from the drop-down menu of available groups. Use the Search text box to filter the list of available groups. You can deselect any selected items or to cancel all your previous selections, click Clear All.
Select Exclude if you do not want to include in the visualization graph the groups you had selected. By default, the selected groups are included in the displayed graph. Click Apply after making your selections.
Clustering of Group Nodes
By default, when you access , and if there are less than 500 group nodes or less than 5000 flows to display, the group nodes are displayed with the No Clustering mode applied. If those limits are exceeded, the Clustering By Flows mode is the default mode used. These modes are based on the traffic flows that occurred between compute entities in the groups in your NSX environment during the selected time period. With the clustering feature, you can have a high-level view of the activities in your NSX environment during the selected time period which can help you decide where to focus your attention.
If you have just activated NSX Intelligence and you navigate to , you might see a single collection of groups labeled as Unclustered (n), where n is the total number of groups in your NSX inventory. Even if traffic flows between the groups are already visualized in the NSX Intelligence canvas, it might take the NSX Intelligence clustering job some time to complete the analysis of the flows and cluster the groups based on the traffic flows that have occurred during the selected time period.
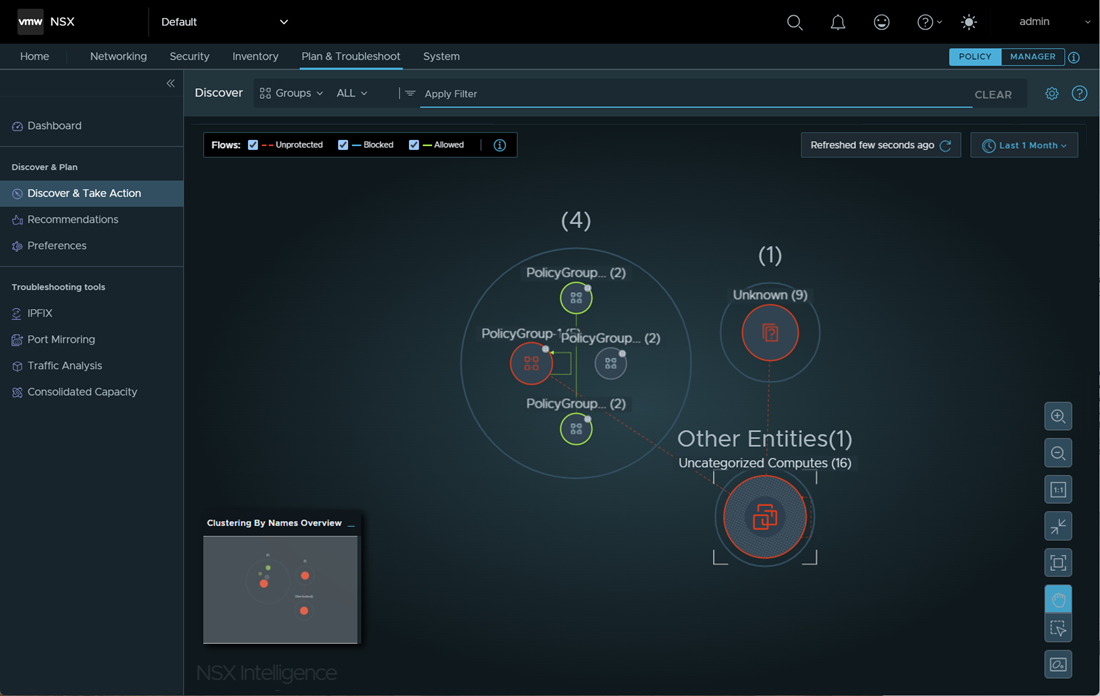
The colors of the nodes correspond to the types of traffic flows that occurred with the groups during the selected time period.
The number displayed on top of the node boundary for the group cluster indicates how many groups are included in that particular cluster for the selected time period. To view more details about a specific cluster and the groups that are part of that cluster, zoom in on the graph. As you zoom in closer to the nodes and arrows, the details about the groups and traffic flows become more visible and easier to select. To narrow which groups are displayed in the visualization graph, apply filters in the Apply Filter section.
To change the clustering mode used for the visualization, click the clustering control icon ![]() located at the bottom right of the visualization graph. You can select one of the other available modes, such as clustering by Flows, Names, or Tags. The system updates the visualization graph immediately based on your clustering mode selection.
located at the bottom right of the visualization graph. You can select one of the other available modes, such as clustering by Flows, Names, or Tags. The system updates the visualization graph immediately based on your clustering mode selection.
Nodes in the Groups View
A node in a Groups view represents a group of NSX compute entities (such as VMs, physical servers, and IP addresses) or a group of uncategorized compute entities in your NSX inventory. The Groups view also includes nodes that represent entities that communicated with members of the groups but are not part of your NSX inventory.
Type of Group Node |
Icon |
Description |
|---|---|---|
Regular Group |
|
A Regular Group node in the NSX Intelligence visualization graph represents any collection of compute entities managed in your NSX environment. The NSX Intelligence graph supports regular groups with compute entities that include VMs, physical servers, IP addresses, or a combination of those entities. An NSX entity can belong to more than one group and can appear in more than one regular group node. |
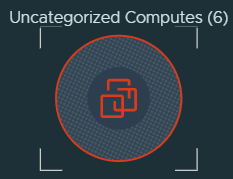
Uncategorized Group |
|
An Uncategorized Group node represents a collection of compute entities that do not belong to any group but are in your NSX inventory. |
Unknown Group |

|
An Unknown Group node represents a set of miscellaneous compute entities that are not in the NSX inventory, but are within your data center, and are communicating to one or more NSX entities in your NSX data center. |
| Public IPs Group |

|
A Public IPs Group node represents a collection of public IP addresses (IPv4 or IPv6) that are communicating to NSX objects in your NSX data center. NSX Intelligence classifies any IP address that does not belong to any of the CIDR notations listed in the Private IP Range Settings for NSX Intelligence as a public IP address. |
Size and Color of a Node
The size of a node in the Groups view is based on the number of compute entity members belonging to that group. The bigger the size of a group node, the more compute entities belong to that group. The group name and its total number of members are displayed above the node.
Type of Group Node |
Description |
|---|---|
|
A group node with a red-hued border indicates that the system detected at least one unprotected traffic flow, regardless of the number of blocked or allowed flows that the system detected during the selected time period. |

|
A blue-hued border on a node means that the system did not detect any unprotected traffic flows, but detected at least one blocked flow, regardless of how many allowed flows were detected during the selected time period. |

|
A node with a green-hued border indicates that the system did not detect any unprotected or blocked flows during the selected time period, and the system detected at least one allowed flow. |
|
|
A node with a gray-hued border means that during the selected time period there were no traffic flows detected for the compute entities belonging to that group. |
Arrows in a Groups View
The arrows between the group nodes represent the traffic flows that have occurred during the selected time period between the compute entities in those connected group nodes. A self-referencing arrow on a group node indicates that at least one compute entity was communicating with another compute entity within that same group. See Working with Traffic Flows in NSX Intelligence for more information.
Node Selection in Groups View
UbuntuVMGroup.
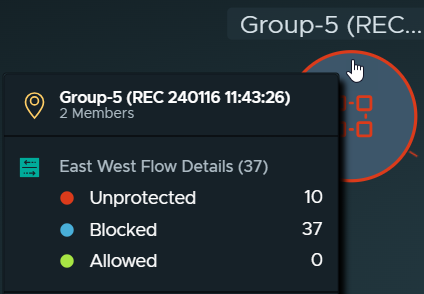
The group's name and the number of members that belong to the group are displayed. If the group was added during the selected time period, a green New badge icon ![]() is displayed on the edge of the group's node. If the group was removed during the selected time period, the
is displayed on the edge of the group's node. If the group was removed during the selected time period, the ![]() icon is displayed on the node's edge. Any additional details about the status of the group during the time period are also displayed in the pop-up window. The total number of flows and the number and types of flows detected during the selected time period are listed. If there are any, the number of recommendations available for the group is also displayed.
icon is displayed on the node's edge. Any additional details about the status of the group during the time period are also displayed in the pop-up window. The total number of flows and the number and types of flows detected during the selected time period are listed. If there are any, the number of recommendations available for the group is also displayed.
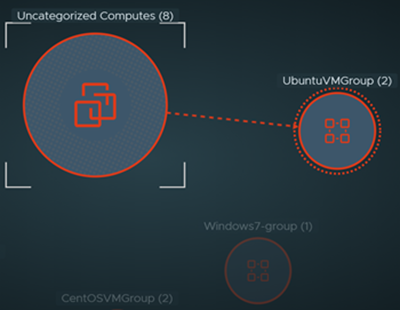
UbuntuVMGroup node is selected and becomes the pinned group node. The
Uncategorized Computes group shared at least one traffic flow with at least one
UbuntuVMGroup member during the selected time period and it is also made prominent. All the other groups that did not communicate with
UbuntuVMGroup during the selected time period are dimmed in the view.
To clear the pinned selection, click any empty area of the visualization canvas.
If you zoom out of the Groups view and the details on the nodes are no longer visible, point to any visible part of a node to display the group details.
Selecting Multiple Group Nodes
To select one or more of the group nodes, click the selection control icon ![]() located at the bottom right of the visualization graph. You can click individual nodes one at a time or drag your pointer over the group nodes that you want to select. You can also press Shift+click and the specific group nodes to make your selection.
located at the bottom right of the visualization graph. You can click individual nodes one at a time or drag your pointer over the group nodes that you want to select. You can also press Shift+click and the specific group nodes to make your selection.
A new Selected panel appears to the right of the Flows section and displays the number of selected group nodes, as illustrated by this image  . From this Selected panel, you can click the recommendation icon
  to start a new recommendation analysis using the selected group nodes. You can also click the
 ![]() to hide all the flows that occurred with the selected groups from being displayed in the visualization canvas. To clear your selections, close the Selected panel.
to hide all the flows that occurred with the selected groups from being displayed in the visualization canvas. To clear your selections, close the Selected panel.
Available Actions in the Groups View
When you right-click a group node, a contextual menu of available actions for the group is displayed, as illustrated in the following image. If the group is eligible for DFW recommendation discovery, the recommendation options are also listed in the contextual menu.
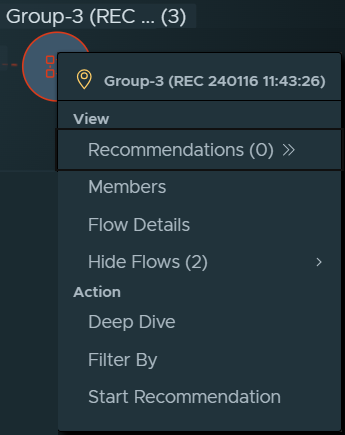
The following table describes the available actions you can select from the drop-down menu.
Selection |
Description |
|---|---|
| View Recommendations (<n>) |
If the group is not deleted, displays the table of available recommendations for the current group. From that Recommendations table, you can view the recommendation details and perform the available actions. See Working with NSX Intelligence Recommendations for more information. |
View Members |
Displays a table of all the compute entity members that belonged to the currently pinned group during the selected time period. From that Members table, you can see the details about the VMs, IP addresses, and physical servers that belong to the selected group and the other groups to which each compute entity also belongs. To add a specific VM, IP address, or physical server to the current visualization filter, click the filter icon |
View Flow Details |
Displays the Flow Details of a Group dialog box, which contains a table for the currently selected group. The table shows details about the flows that have been completed and the flows that were active during the selected time period. See Working with Traffic Flows in NSX Intelligence for more information. |
View Hide Flows |
Displays a secondary menu of flow types that you can choose to not include in the visualization display. As shown in the following image, you can choose to hide traffic flows that are incoming to the group, outgoing from the group, or flows that occurred within the group. 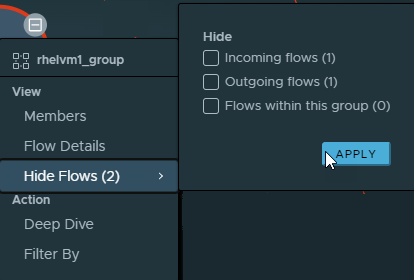
After you make your selection, click Apply and the visualization graph is refreshed using the newly applied option. To indicate that there are flows not being displayed for the time period, the hidden flow icon  is added to the Flows panel and the group node's border, as shown in the following image. is added to the Flows panel and the group node's border, as shown in the following image.
|
Deep Dive action |
Surrounds the selected group node with a dashed circle to mark it as the pinned group node or the current group in focus. The compute entities that belong to the group are shown inside the group node. All the groups that had traffic flows with the members of the pinned group during the selected time period are also placed in the Groups view. In the following example, the Windows7-group node is the pinned group. The other groups are in the view because their members had network traffic flows exchanged with the single VM in Windows7-group during the selected time period. 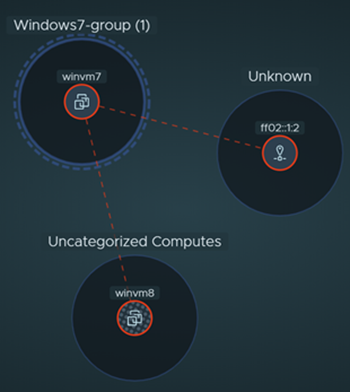 |
Filter By |
Adds the current group to the visualization filter that is used for the current Groups view. The visualization canvas gets refreshed when the filter is applied. |
Start Recommendation |
If the group is eligible for DFW recommendation analysis (not deleted), this option displays the Start New Recommendation wizard that assists you with generating a new DFW microsegmentation rule recommendation. See Generate a New NSX Intelligence Recommendation for details. |
 on the right.