After NSX Intelligence collects network traffic flow data, the NSX Suspicious Traffic engine generates network threat analytics on that collected data and uses the Events page to report any suspicious traffic events it detected. You can view information about the suspicious traffic events in either a bubble chart, a grid, or both formats.

Prerequisites

Managing suspicious traffic events

By default, when you navigate to Security > Suspicious Traffic > Events, you see the suspicious traffic events displayed in both the bubble chart and grid formats, as shown in the following image. The table that follows the image describes the numbered sections highlighted in the image.
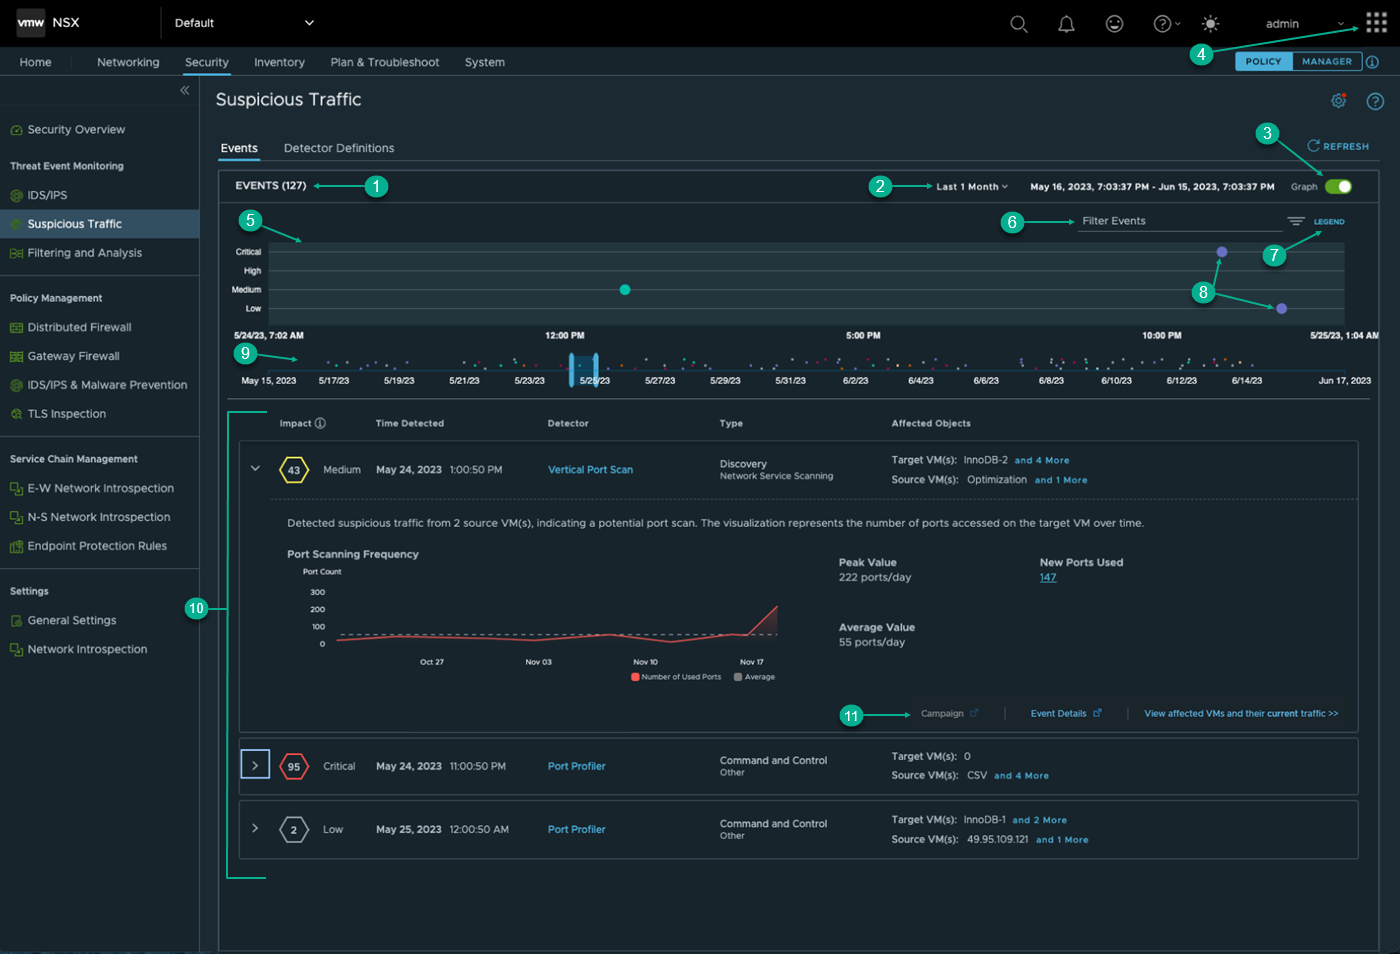

Screenshot of the Events tab in the Suspicious Traffic UI page.

Section

Description

1

Gives the total number of suspicious traffic event detections that the NSX Suspicious Traffic feature made during the selected time period.

2

In this section, you select the time period that the system uses to determine which historical data about the detected events are reported by NSX Suspicious Traffic on this UI page. The time period is relative to the current time and some time period in the past. The default time period is Last 1 hour. To change the selected time period, click the current selection and select another from the drop-down menu. The available selections are Last 1 Hour, Last 12 Hours, Last 24 Hours, Last 1 Week, Last 2 Weeks, and Last 1 Month.

3

The Graph toggle determines if the bubble chart is displayed or not. When the Graph toggle is turned off, only the grid displays information about the suspicious traffic events. By default, it is toggled to On.

4

If the NSX Network Detection and Response feature is activated, when you are viewing the NSX Suspicious Traffic user interface, the application launcher icon application launcher icon is visible in the upper-right corner of the UI.

To view more details about the detected anomalous events using the NSX Network Detection and Response UI, click the application launcher icon icon and select NSX Network Detection and Response. From the NSX Network Detection and Response UI, click the application launcher icon again and select NSX to return to the NSX Suspicious Traffic UI.

5

This bubble chart provides a visual timeline of when the detected events occurred during the selected time period. Each event is plotted based on the severity of the suspicious traffic event. The following are the severity categories and their corresponding severity scores.

  • Critical: 75-100
  • High: 50-74

  • Medium: 25-49

  • Low: 0-24

6

The filter area enables you to narrow down the suspicious traffic events that are displayed for the selected time period. Click Filter Events and select from the drop-down menu the filters you want applied and specific items in the secondary drop-down menu that is displayed. The available filters include the following.

  • Confidence Score - The score the system assigns based on how confident it is that an event is anomalous using the proprietary algorithms that the NSX Suspicious Traffic feature use.

  • Detector - A sensor designed for detecting anomalous events in your network traffic flow. A detector maps to a single MITRE ATT&CK category or technique.

  • Impact Score - A score calculated by a proprietary algorithm which uses a combination of the confidence score for the suspicious traffic event and its severity, if correctly detected.

  • Tactics - Represent the reason why an adversary performed an action using an ATT&CK tactic.

  • Techniques - Represent how an adversary tries to achieve a tactical goal of their attack using specific techniques/sub-techniques.

  • VMs - The VMs that participated in the detected events that occurred during the selected time period.

7

Click Legend to list the different types of bubbles that can appear in the bubble chart. The following list describes each bubble and the type of suspicious traffic event it represents.

  • Persistence - The adversary is trying to maintain their hold on the systems in your network.

  • Credential Access - The adversary is trying to steal account names and passwords.

  • Discovery - The adversary is trying to learn about your network environment.

  • Command and Control - The adversary is trying to communicate with jeopardized systems and control them.

  • Lateral Movement - An adversary is trying to move through your network environment.

  • Collection - An adversary is attempting to gather information that would be helpful in their final goal.

  • Exfiltration - The adversary is trying to steal data from your network.

  • Other - The detector cannot be associated to a specific tactic as defined in the MITRE ATT&CK Framework.

  • Multiple events - More than one suspicious traffic event occurred around the same time segment. Moving the time window slider to the right changes the scope of what type of bubbles are displayed, so a Multiple Events bubble can be broken up into multiple and other types of bubbles. If you click a multiple event bubble, you see the list of all events in a signpost. Clicking a row in table in the signpost takes you to the related bubble's row in the grid below.

8

Each bubble in the chart represents a suspicious traffic event or multiple events that occurred during the selected time period. The color or type of bubble represents the tactic used by the adversary during the detected attack. See the descriptions in Legend for more information.

9

The time window slider allows you to view suspicious traffic events that occurred within a subset of the selected time period. The highlighted blue area represents what is displayed in the bubble chart. As you slide the slider to the right or left, the bubble chart gets updated with the suspicious traffic events that occurred during the period highlighted in the slider. If there are suspicious traffic events that occurred around the same time, a Multiple Events bubble represents those suspicious traffic events. When you move the slider to the right, you will notice that the Multiple Events bubble expands into the multiple bubbles that represent the different suspicious traffic events that occurred around that time period.

10

The grid displays information about each suspicious traffic event that the NSX Suspicious Traffic feature identified during the selected time period. When not expanded, a row shows the following key event data.

  • Impact - The number shown inside the hexagon is the Impact Score that the NSX Suspicious Traffic feature calculated for the suspicious traffic event. The Impact Score is the combination of the confidence of the event (Confidence Score) and how bad the threat is (Severity Score), if correctly detected. Pointing to the hexagon icon displays a tooltip containing the Confidence Score and the Severity Score. The color of the hexagon and the text next to the hexagon are two other representations of the same Impact Score. The Impact Scores are defined as follows.

    • Impact Score of 75 to 100 is represented by a red-bordered hexagon and the text Critical.
    • Impact Score of 50 to 74 is represented by an orange-bordered hexagon and the text High.
    • Impact Score of 25 to 49 is represented by a yellow-bordered hexagon and the text Medium.
    • Impact Score of 0 to 24 is represented by a gray-bordered hexagon and the text Low.
  • Time Detected- The date and time the event was detected.

  • Detector - The name of the detector that the NSX Suspicious Traffic feature used to detect the event. When you click the detector name, a dialog box displays more information about the detector, such as its goal, ATT&CK category, and an abstract about the detector. The ATT&CK Category section includes a link to the MITRE ATT&CK web site that gives more details about that particular ATT&CK category used in the suspicious traffic event.

  • Type - Lists the tactic and technique used in the suspicious traffic event

  • Affected Objects - Lists the source VMs and target VMs involved in the suspicious traffic event.

The example screenshot also shows an expanded row. When expanded, a row displays more event information. The details include a summary of the event that was detected and an explanation for the visualization or more event data displayed in the expanded row. For example, in the above screenshot, the expanded row displays a summary of the detected event and what the visualization represents. Not all of the suspicious traffic events will have visualization. Others only have more detailed data.

11

An expanded row might also display one or more links in the bottom-right corner. When clicked, a link takes your view to another UI page where more information about the detected event is provided. The following are the available links, when applicable for the suspicious traffic event.

The following link might be enabled, even if the NSX Network Detection and Response feature is not activated.

  • View affected VMs and their current traffic - When you click this link, the system displays the visualization canvas in the Plan & Troubleshoot tab. It shows the compute entities that were involved in the suspicious traffic event. See Working with the Computes View in NSX Intelligence for more information.

If the NSX Network Detection and Response application is activated, the following links might also be available if applicable for the event.

  • Campaign - If the NSX Advanced Threat Prevention cloud service identified this suspicious traffic event to be part of a campaign, this link is enabled. When you click the link, details about the campaign are displayed on the Campaigns page of the NSX Network Detection and Response user interface. For more information, see the "Managing the Campaigns Page" topic in the NSX Network Detection and Response section of the Security chapter of the NSX Administration Guide. You can find NSX Administration Guide version 3.2 and later in the VMware NSX Documentation set.
  • Event Details - When you click this link, a new browser tab is opened and more details about the suspicious traffic event are displayed in the Event Profile page of the NSX Network Detection and Response user interface. For more information, see the "Working with the Events Page" topic in the NSX Network Detection and Response section of the Security chapter of the NSX Administration Guide. You can find NSX Administration Guide version 3.2 and later in the VMware NSX Documentation set.
  • New Ports Used - When you click this link, a dialog opens to show the ports of VMs. The VMs tab lists the VM names first and associated ports. Both tabs list the ports and associated VMs that were scanned for suspicious traffic.