


The Security IntelligenceDashboard displays high-level information about the most recent state of the network activities and objects that the Security Intelligence handles. The summary includes an overview of the pending actions that might require your immediate attention, status of data collection activities, network security posture, flow trends, suspicious traffic summary, and insights into the network traffic flow data that has been collected.
The Dashboard page becomes available for your use after the Security IntelligencePrerequisites are satisfied and the Security Intelligence feature is activated. To see the Security IntelligenceDashboard, click from the NSX Manager UI.
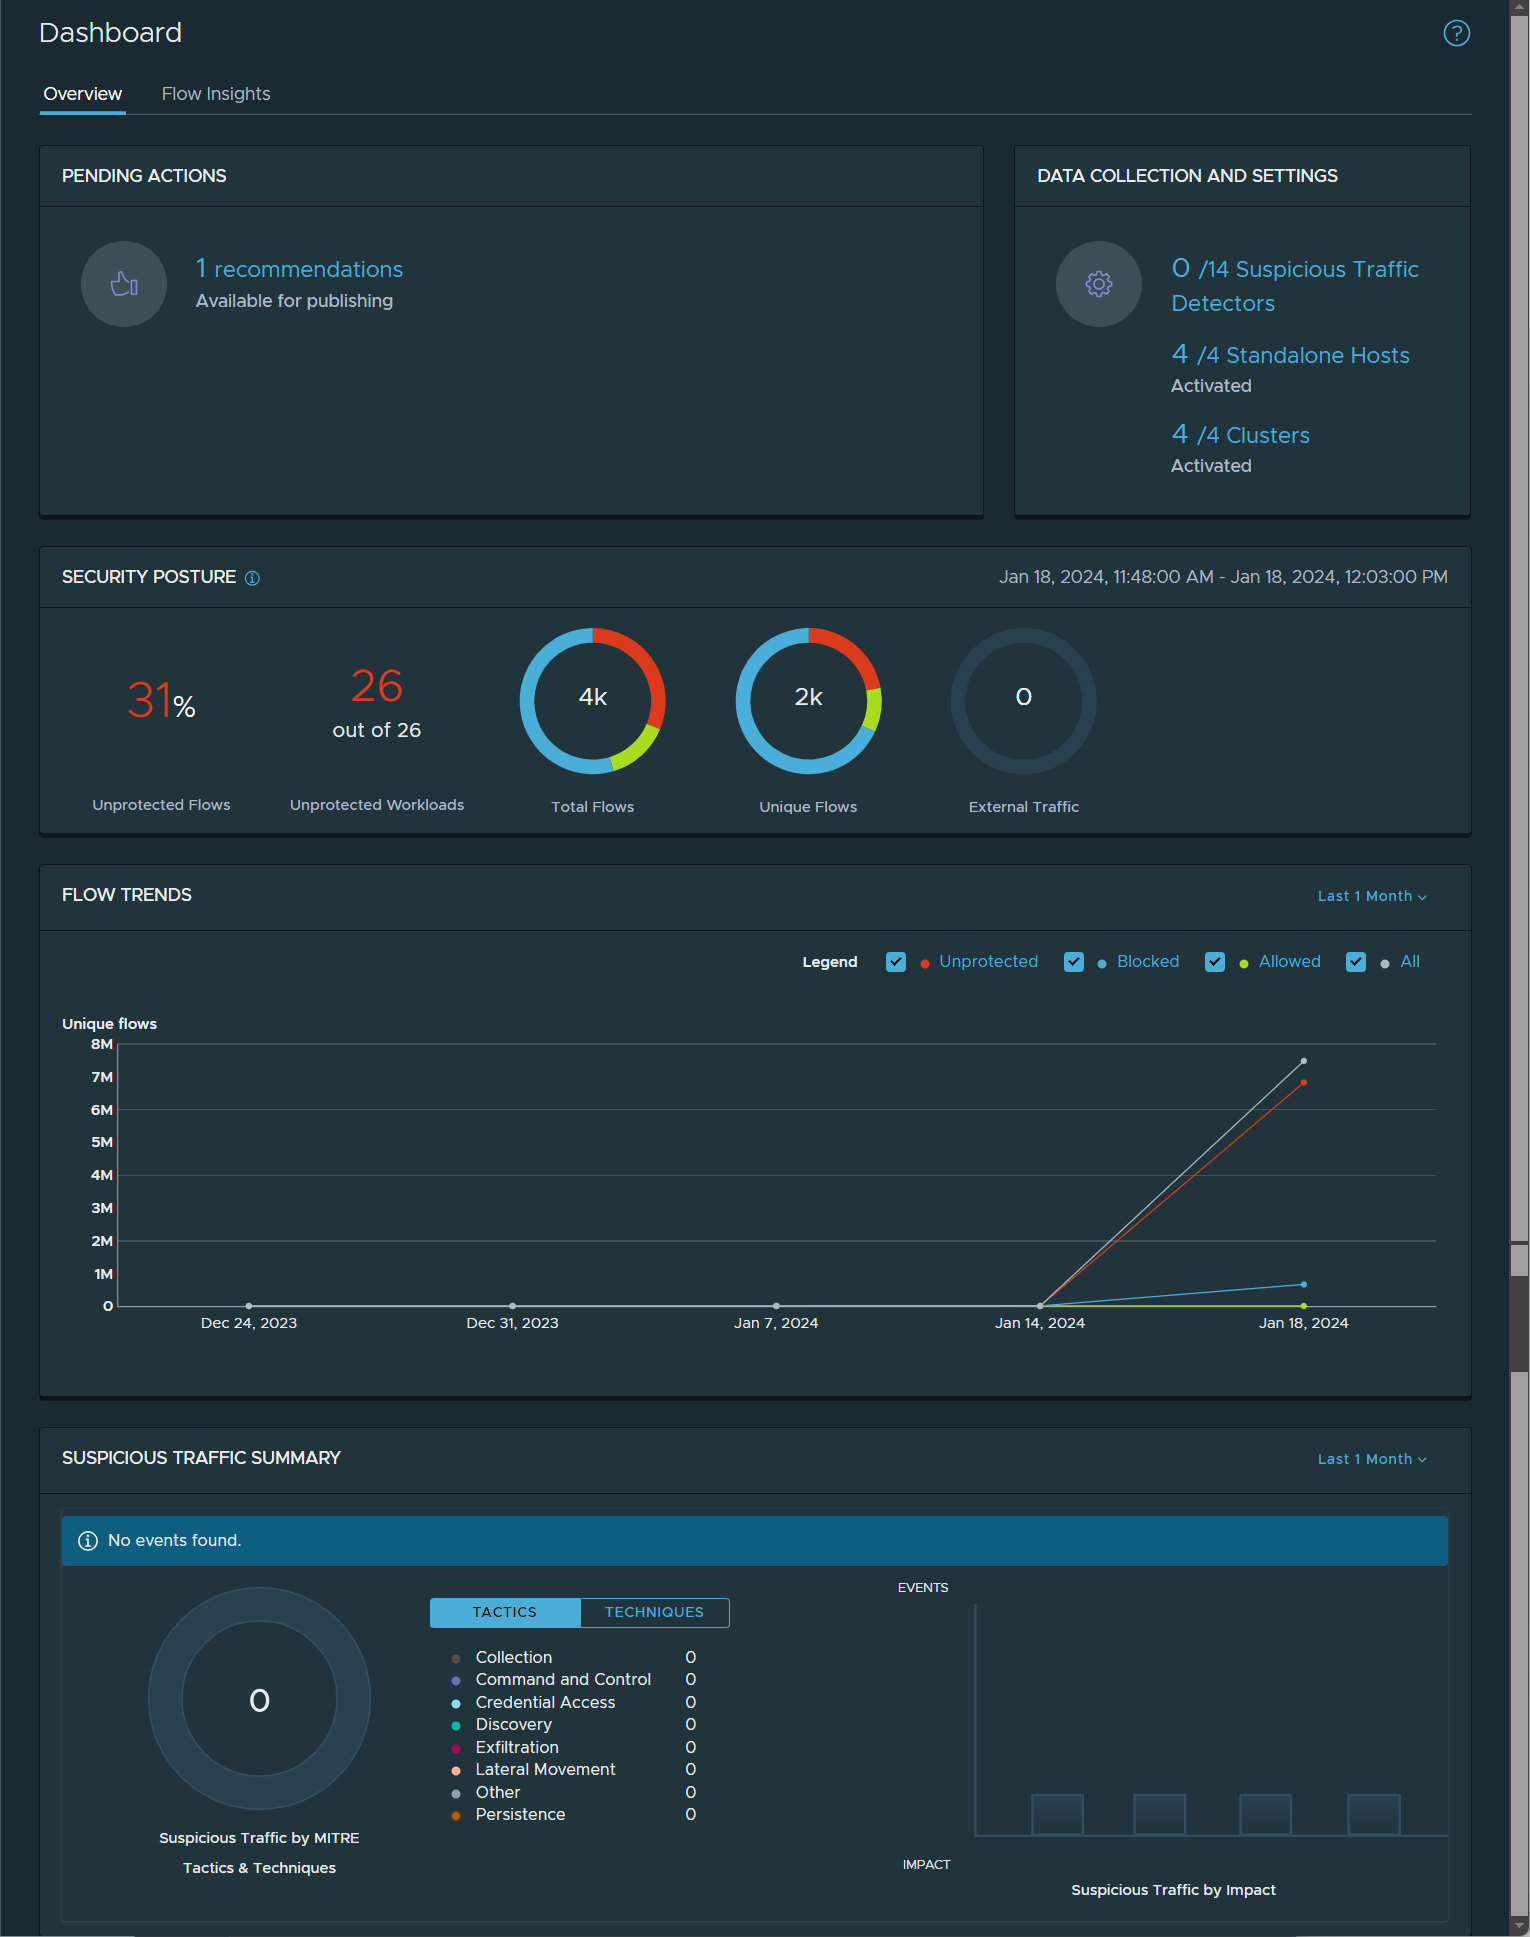
Overview dashboard
The different sections in the Overview dashboard provide status summaries and links to the Security Intelligence UI pages where you can further review the latest status information and take the appropriate actions.
The following image illustrates an example of the Security Intelligence tab.
| Section Name | Description |
|---|---|
| Pending Actions |
If applicable, this section displays the following statuses that might require your action.
|
| Data Collection and Settings | This panel provides the number of Suspicious Traffic detectors that are currently activated. It also lists the latest data collection status for standalone hosts and cluster of hosts. To manage the suspicious traffic detectors and the data collection settings, click the link associated with the status and the corresponding Preferences page is displayed.
See the following topics for more details.
|
| Security Posture |
This section provides the overall network security status (within the last 15 minutes) that are currently identified in your
NSX environment.
You can use the security posture information shown on this Security Posture dashboard panel to manage, plan for, and implement more security policies.
See the following topics for more information.
|
| Flow Trends | The line charts displayed in this section represent the trends in the unique traffic flows that Security Intelligence detected within the last one month (by default). To configure another time range to be used for the chart, select another value in the time period drop-down menu located in the upper-right corner of the Flow Trends dashboard panel. The time periods available for selection are Last 24 Hours, Last 1 Week, and Last 1 Month. The colors of the lines displayed in the chart represent the flow types. The Legend section lists the different flow types: Unprotected, Blocked, Allowed, and All flows. Use the Legend section to select and deselect the types of flows that you want to be displayed in the chart. When you point to a section on the graph, a card displays a summary of the aggregated flow data for that specific time point within the selected time range. To pin the card to allow you to view the data more easily, click anywhere in the chart. 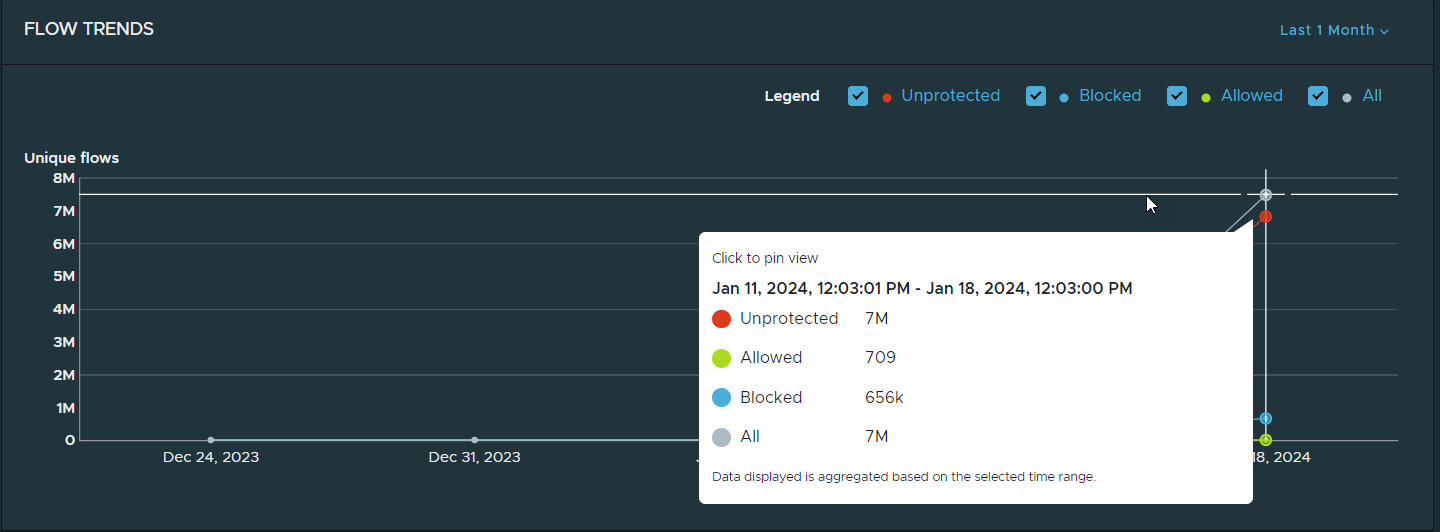
|
| Suspicious Traffic Summary | This section displays a summary of the suspicious traffic events detected during the last one month (by default). To configure another time range to display in the chart, select another value in the time period drop-down menu located in the upper-right corner of the Suspicious Traffic Summary panel. The time periods available for selection are Last 1 Hour, Last 12 Hours, Last 24 Hours, Last 1 Week, Last 2 Weeks, and Last 1 Month. The donut chart represent the total number of suspicious traffic events that Security Intelligence detected within the specified time period. Each color-coded section in the chart represents a specific detector technique or tactic used by the supicious event that Security Intelligence detected. The number in the middle of the donut chart gives the total number of suspicious traffic events detected during the selected time period. The table to the right of the donut chart lists the tactics and techniques that Security Intelligence supports and the number of detected suspicious events that used the tactic or technique during the selected time period. The bar chart on the right displays the number of detected suspicious traffic events by their impact type. The Impact type can help you decide to which event to prioritize. The impact types are Critical, High, Medium, and Low. For more informaiton, see Detecting Suspicious Traffic Events in NSX. |
Flow Insights dashboard
- Rules (Broadmatch, Allowed, and Blocked)
- Groups (Source and Destination)
- Computes (Source and Destination)
- Destination Ports
- L7 Application IDs
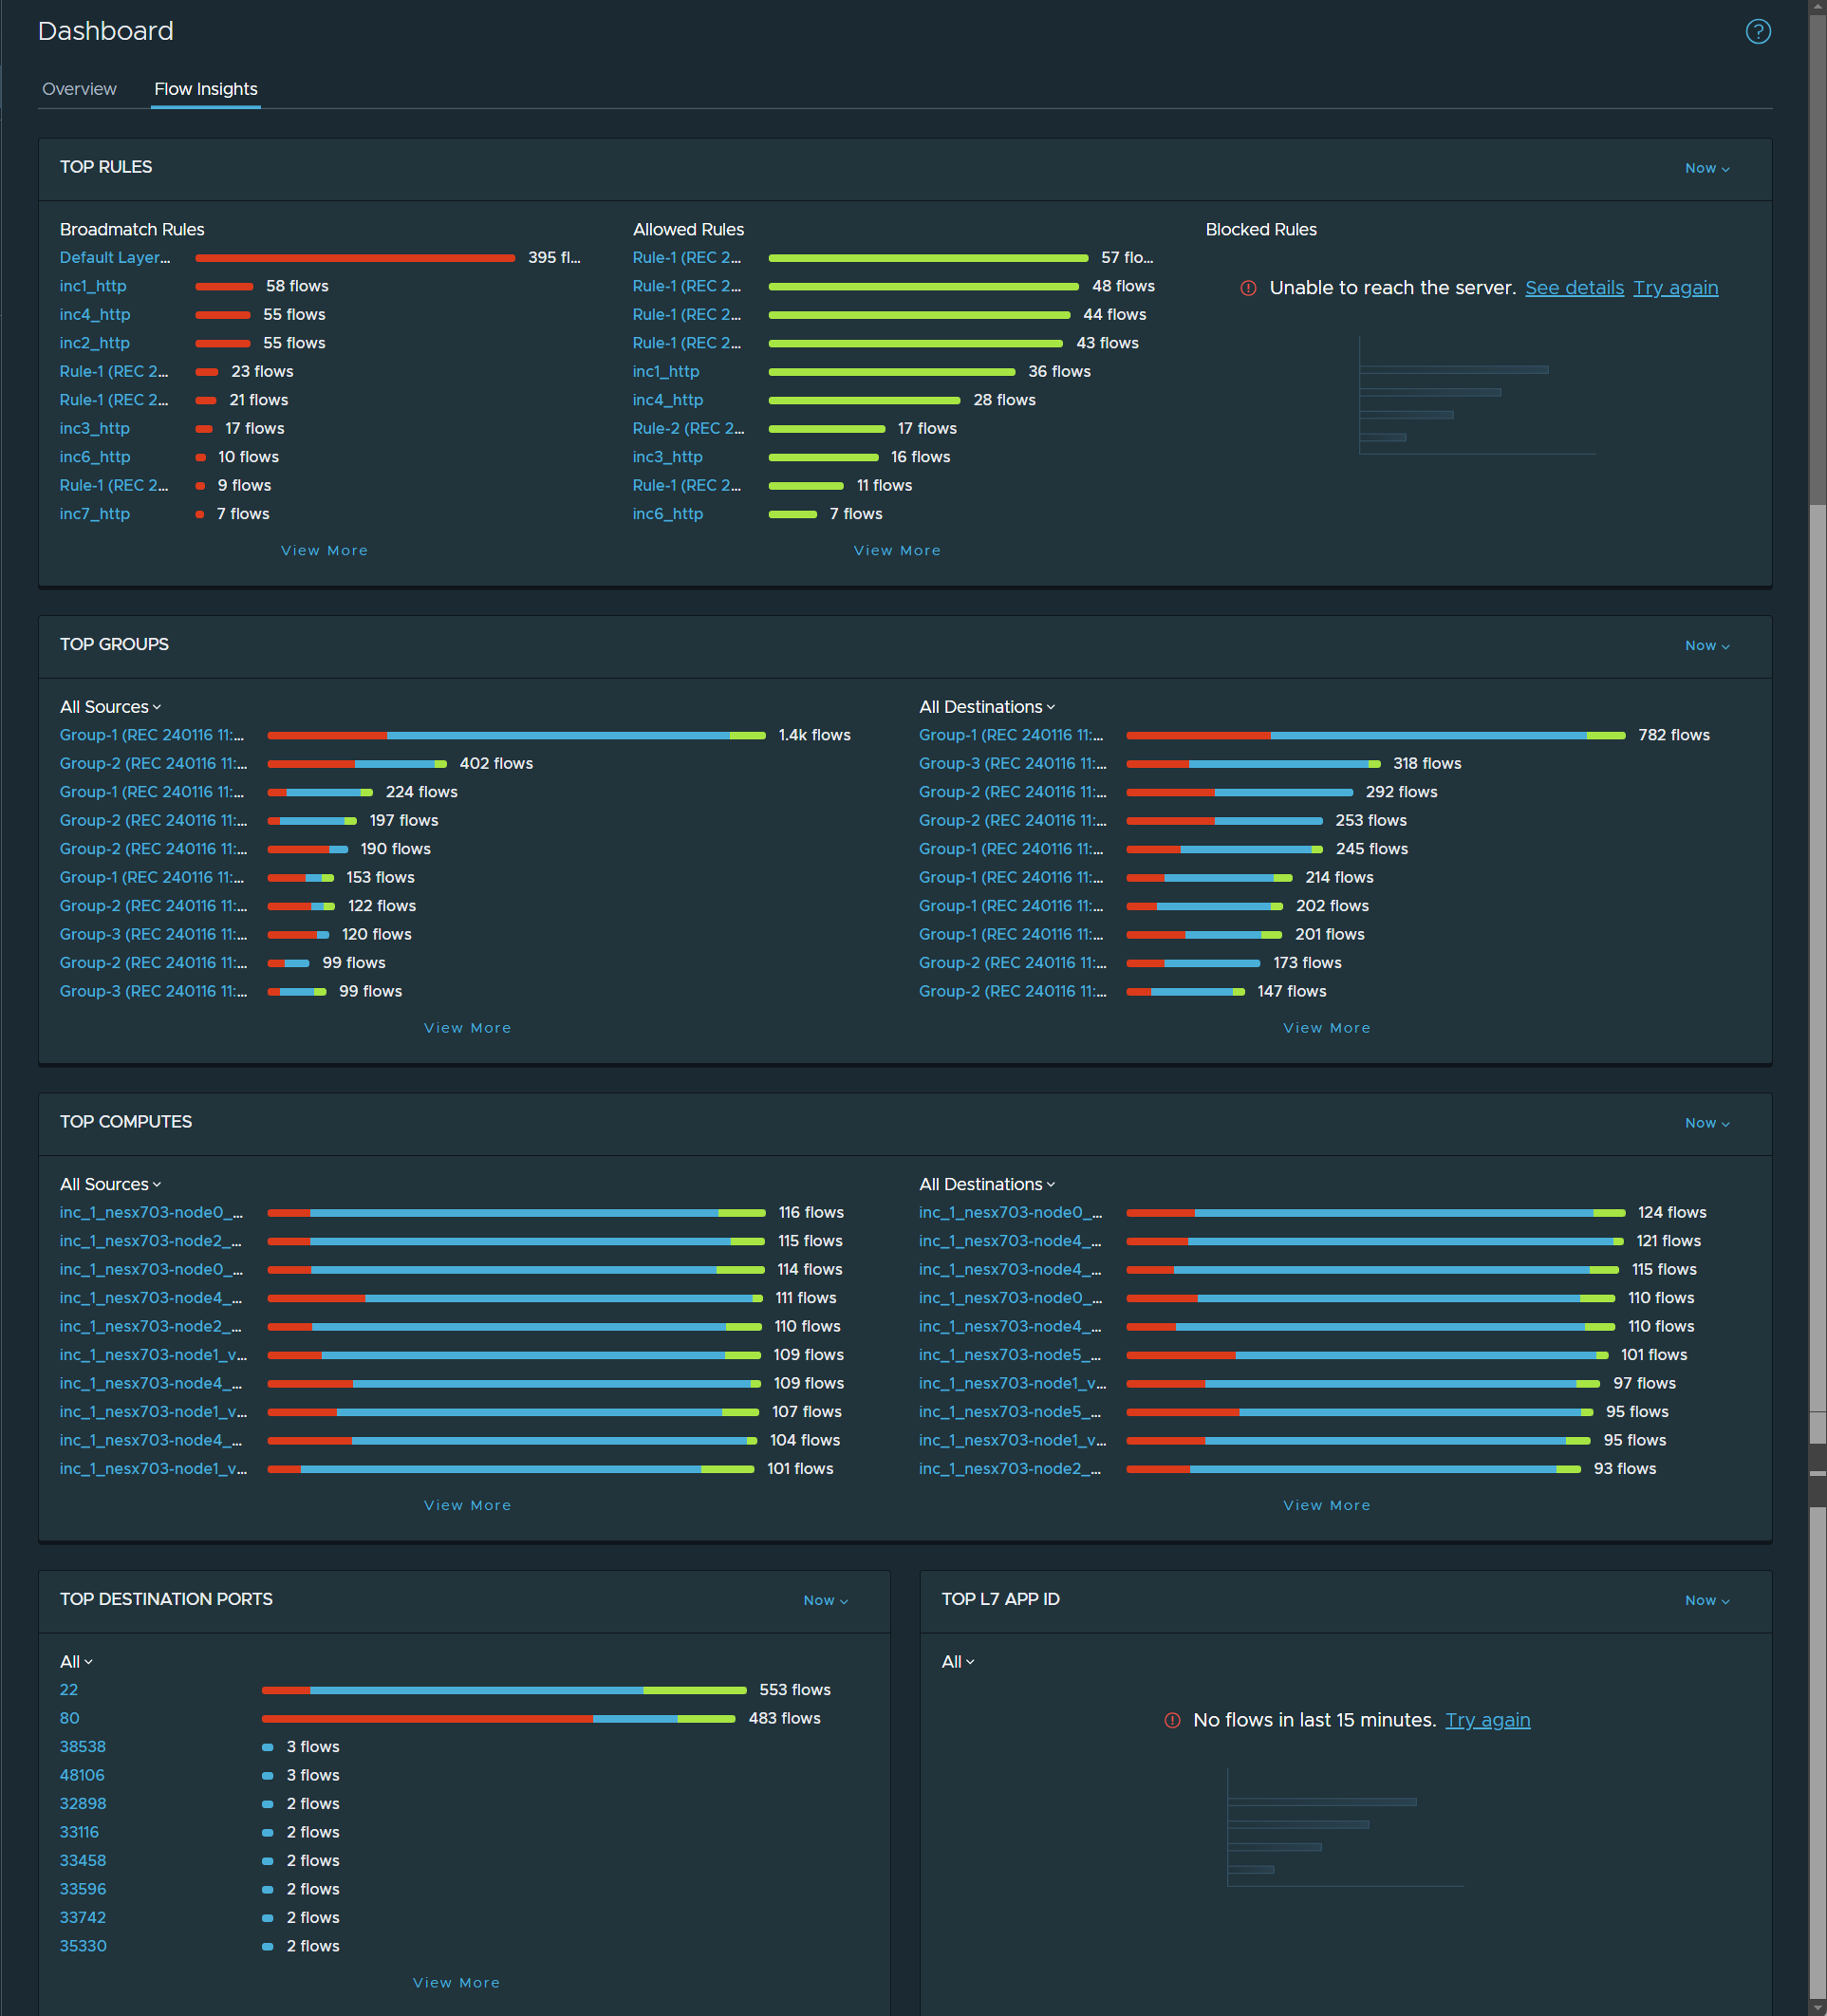
Each category panel in each section displays the top 10 network objects that had the most unique flows that occurred during the currently selected time period. To display information for more objects in a specific panel in each section, click View More at the bottom of the panel.
For each section, the default time period used to filter the displayed data is Now (the last 15 minutes). To view information for a different time period, click Now and select from the drop-down menu located in the upper right corner of each section. The available time periods are Now, Last 1 Hour, Last 12 Hours, Last 24 Hours, Last 1 week, Last 2 Weeks, and Last 1 Month.
| Section Name | Description |
|---|---|
| Top Rules | Displays three panels with bars that represent the top 10 rules with the most traffic flows in each of the three rule categories during the selected time period. The three rule categories are Broadmatch Rules, Allowed Rules, and Blocked Rules. Click a rule's name to view all the traffic flows with the specific rule in the Discover & Take Action visualization canvas. |
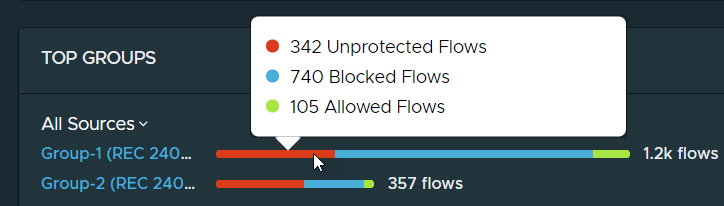
| Top Groups | Displays two panels that show the top 10 groups that sent (source) or received (destination) the most unique traffic flows within the currently selected time period. The colors on the bar for each object indicate the relative number of unprotected flows, allowed flows, and blocked unique flows that the group object sent or received. When you point to the bar, a tooltip will show the exact number of unprotected, allowed, and blocked unique flows.
To filter the flow information by the flow type, click the drop-down menu located above the panel and select the flow type that you want displayed, as illustrated in the following image.
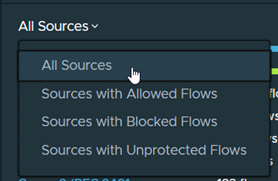
Click the object's name to view the group object in the Discover & Take Action visualization canvas. |
| Top Computes | Displays two panels that show the top 10 compute entities that sent (source) or received (destination) the most unique traffic flows within the currently selected time period. The colors on the bar for each object indicate the relative number of unprotected flows, allowed flows, and blocked unique flows that the compute object sent or received. When you point to the bar, a tooltip will show the exact number of unprotected, allowed, and blocked unique flows. To filter the flow information by the flow type, click the drop-down menu located above the panel and select the flow type that you want displayed. Click a compute object's name to view information about it in the Discover & Take Action visualization canvas. |
| Top Destination Ports | Displays the top 10 port objects that received the most unique traffic flows within the currently selected time period. The colors on the bar for each object indicate the relative number of unprotected flows, allowed flows, and blocked unique flows that the port object received during the specified time period. When you point to the bar, a tooltip will show the exact number of unprotected, allowed, and blocked unique flows the port received. To filter the flow information by a specific flow type, click the drop-down menu located above the panel and select the flow type that you want displayed. Click the port's name to view all the compute objects with that destination port in the Discover & Take Action visualization canvas. |
| Top L7 Application ID | Displays the top 10 L7 application ID objects that received the most unique traffic flows within the currently selected time period. The colors on the bar for each object indicate the relative number of unprotected flows, allowed flows, and blocked unique flows that the L7 application ID object received during the specified time period. When you point to the bar, a tooltip will show the exact number of unprotected, allowed, and blocked unique flows the port received. To filter the flow information by a specific flow type, click the drop-down menu located above the panel and select the flow type that you want displayed. Click the L7 Application ID's name to view the flows with that particular L7 application ID in the Discover & Take Action visualization canvas. |
