


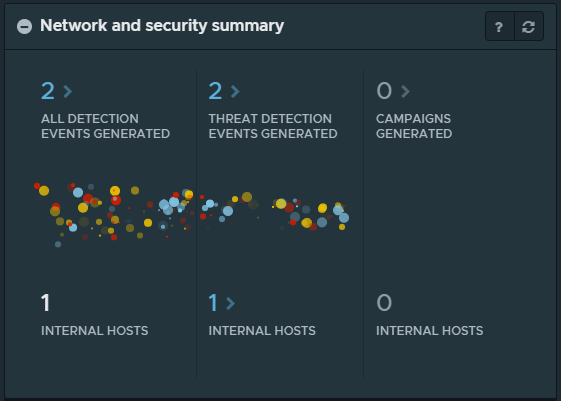
The Network and security summary widget shows how the NSX Network Detection and Response processes and analyzes network traffic flow data.
The widget shows the processing pipeline used for analyzing all events (including informational events), detecting threat events (only important events), and generating campaigns.
When you click the count link for the All Detection Events Generated segment, you are taken to the Events page, which is filtered to display all the detection events, including unimportant info detection events. See Working with the Events Page for more details.
Clicking the count link for the Threat Detection Events Generated segment takes you to the Events page, which has been filtered to display the list of threat detection events only. Clicking the count link below the Threat Detection Events Generated segment takes you to the Hosts page. See Working with the Hosts Page.
When you click the count link for the Campaigns Generated segment, you are taken to the Campaigns page, which shows the cards for the detected campaigns. See Managing the Campaigns Page for details.
