


The Overview tab in the Campaign Details page displays a summary of the campaign and an interactive graphical blueprint.
The following information describes the three sections on this tab.
Campaign Threats and Hosts
The Threats and hosts section displays the Threats and Hosts widgets.
The Threats widget displays the current threats that the NSX Network Detection and Response application detected in the selected campaign. The severity of the threat is indicated by the color code: red for high, yellow for medium, and blue for low. Point to the name of the listed threats and a pop-up window displays the IP addresses of the affected hosts. Click View threats details and the Timeline tab displays detailed information about the campaign.
The Hosts widget displays the hosts affected by the selected campaign. The severity of the threat is indicated by the color code: red for high, yellow for medium, and blue for low.
Point to the IP address of an affected host and a pop-up window displays the names of the threats affecting the host. Click View hosts details and the Hosts tab displays detailed information about the hosts.
Campaign Attack Stages
The Attack stages widget displays the attack stages, highlighting the current campaign attack stages. Point to a highlighted activity and a pop-up window displays more information about the attack stage. See Campaign Properties for details about attack stages.
Campaign Blueprint
The Campaign blueprint widget provides an interactive graphical representation of the campaign. It displays the hosts involved in the campaign (both internal and external to your network), the threats that affected them, and additional information that completes the campaign description.
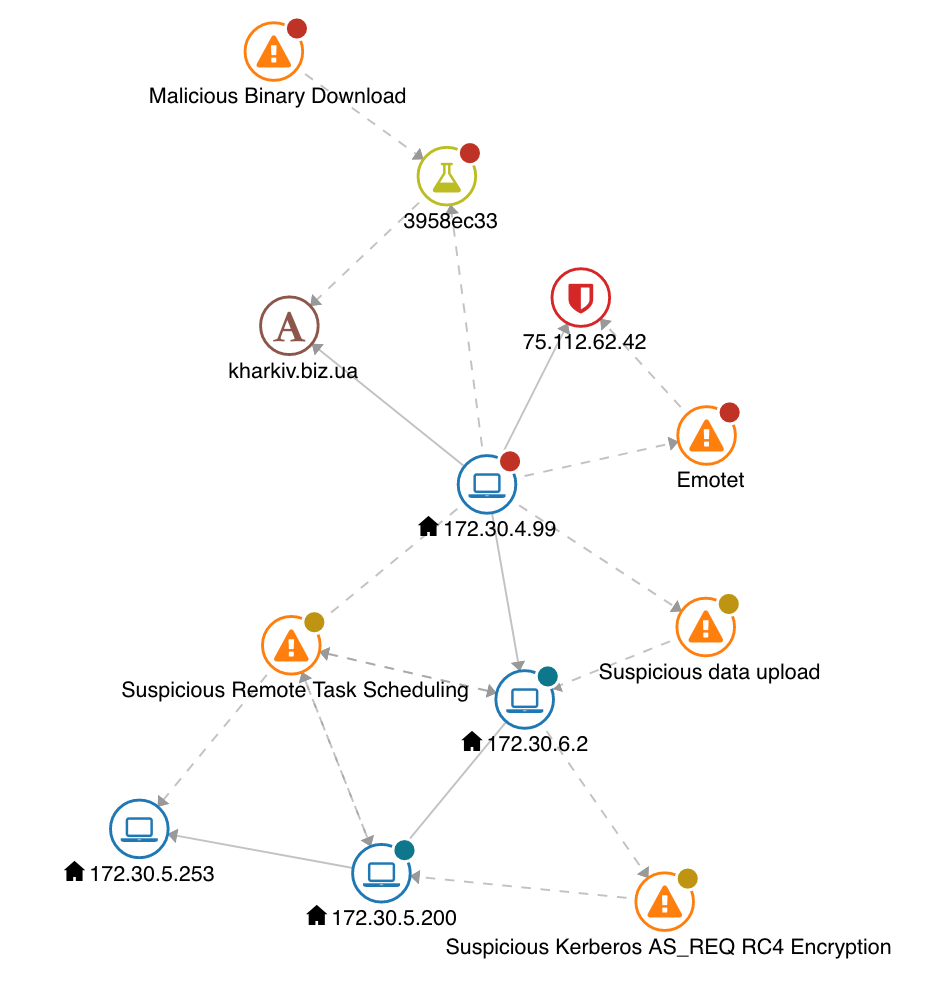
This blueprint graph shows the following activities.
A malicious binary file is downloaded to the host node with label 172.30.4.99. This activity is consistent with a user on that host opening an email (for example, visiting a URL or opening an attachment contained in that email).
The host node with label 172.30.4.99 is connected to the hostname node with label kharkiv.biz.ua. The analysis report 3958ec33 shows that a download was made from the URL http://kharkiv.biz.ua/hPpD/. The analysis report also shows that what is downloaded is a PE executable application, 32-bit, Intel i386 file.
The host node with label 172.30.4.99 is connected to an Emotet command and control. The server is the blocked entry 75.112.62.42.
The host node with label 172.30.4.99 is connected to host node with label 172.30.6.2 with a suspicious data upload and to host nodes with labels 172.30.5.200 and 172.30.5.200 with a suspicious remote task scheduling, all activities associated with lateral movement.
The host node with label 172.30.6.2 is connected to the host node with label 172.30.5.200 with a suspicious Kerberos encryption, an activity consistent with data exfiltration.
Node key
The following node types can appear in the blueprint graph.
| Icon |
Node type |
Description |
|---|---|---|
| |
Analysis report |
This node type represents the results of detonating a sample (file or URL) in the NSX Network Detection and Response sandbox.
|
| Downloaded file |
This node type represents a file that was downloaded in the network.
|
|
| Host |
This node type represents a network device.
|
|
| Info |
This node type represents a detection of an info-level activity. This node only appears in the Network analysis blueprint graph.
|
|
| Threat |
This node type represents a detection.
|
About Edges
The lines that connect the nodes are called edges.
A host node is connected to threat or analysis report nodes with a dotted line to indicate that the host corresponding to the host node was exposed to the threat represented by the threat or analysis report node.
Other connections are represented with a solid line to express that some activity (for example, a network connection, a DNS look-up, or a web request) put the entities corresponding to two nodes in relation.
Blueprint interaction
The blueprint graph is interactive: supporting item selection, moving nodes, and zooming in and out.
Node and edges can be selected by clicking on them: additional information about the selected item is found in the sidebar.
Hovering your mouse over a node colors the connecting edges, highlighting the interaction of that node.
Individual nodes can be dragged to new positions on the graph. The entire graph can be panned, effectively changing the point of view.
The graph can be zoomed in and out by scrolling the mouse wheel. More details are shown at higher zoom levels. In particular, the badge used with several node types to convey impact information is enriched with the actual impact score.
Campaign Sidebar
The Campaign sidebar is used to display information that is relative to one or more elements of the blueprint graph. By default, it is minimized.
-
Click the
 icon to view node or edge information.
 -
Click the
 icon to view third-party tools.
To minimize the sidebar, click the ![]() icon.
icon.
Node or edge information
The node/edge information tab provides additional information about a selected node or edge in the blueprint graph. To select a node, click on its icon in the graph.
| Node type |
Information |
|---|---|
| Analysis report |
Additional information about an analysis report. Report details:
Sightings details of the analyzed sample:
|
| Downloaded file |
Additional information about a downloaded file File details:
Sightings details:
|
| Host |
Additional information about a host. Host-level details:
Incidents involving the host:
A note indicates if the host is internal or external to the monitored network. |
| HTTP request |
Additional information about an HTTP request. URL details:
Request details
|
| Threat |
Additional information about a threat Threat details:
|
When you click an edge, the following information is displayed about the connection:
-
Source node – The source of the connection. This can be a node name, an IP address, a domain name, etc.
-
Target node – The destination of the connection. This can be a node name, an IP address, a domain name, etc.
Under the Source node and Target node is the actual source or target of the connection. Click the ![]() icon to expand the source or target.
icon to expand the source or target.
Third-party tools
The third-party tools tab links to external tools that may provide additional information about an entity selected in the graph. Currently, the tools supported are DomainTools and VirusTotal.
The following searches are supported:
-
Selecting a host node allows you to search for the corresponding IP address on DomainTools and VirusTotal.
-
Selecting a hostname node allows you to search for the corresponding domain name on DomainTools and VirusTotal.
-
Selecting a downloaded file node allows you to search for the corresponding hash on VirusTotal.
-
Selecting an HTTP request node allows you to search for the request's hostname on DomainTools and VirusTotal.
