


The Detected threats widget provides a graphical overview of the different kinds of threats that the NSX Network Detection and Response application has detected in the network.
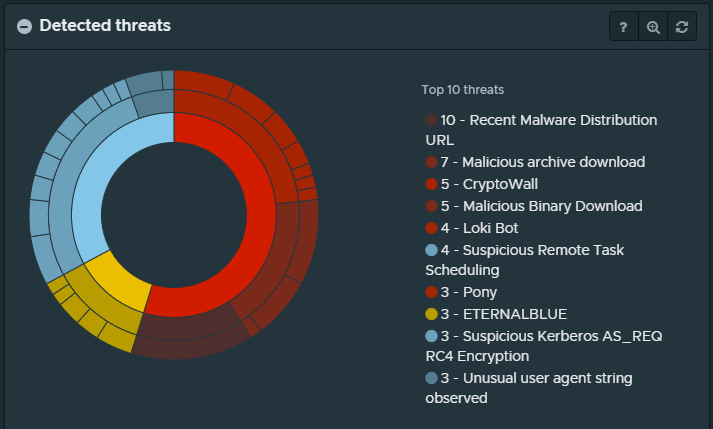
The divisions of the circles represent the number of hosts affected by the displayed incident types. Moving toward the outer circles provides a finer granularity and more specific information.
The innermost ring displays the three different types of incidents.
Incident Type
Description
Infections
These are incidents that the NSX Network Detection and Response application determined to be critical. These incidents have been given an impact score of 70 or higher and are displayed in red.
Watchlist
These are incidents that the NSX Network Detection and Response application determined to be of medium risk. Such incidents, while indicating a potential risk, might not need immediate attention. They are kept under close watch in case new evidence modifies their status. These incidents are assigned an impact score anywhere from 30–69 and they are displayed in yellow.
Nuisances
These are incidents that are considered low or no risk. This typically corresponds to potentially unwanted/risky activity that does not necessarily indicate a compromise or infection on the monitored network. These incidents have been given an impact score of lower than 30 and are displayed in blue.
The middle ring displays the threat class together with the number of relevant incidents for each type of infection. Threat classes include command&control servers, malicious file downloads, crypto-miners, and many more.
The outer ring represents the individual threat families detected in the network. Threat families include ransomware, malicious binary files, and so on.
When you point to the graph, the widget displays the threat name and a count of hosts where the NSX Network Detection and Response application observed the threat.
When you click an item in the graph, the view zooms in and displays more details about the selected information type. Clicking the item again zooms the view back.
If you click an incident type in the inner ring, the graph view zooms in and displays the matching incidents in the middle and outer ring. If you click a threat class in the middle ring, the graph view zooms in and displays the matching threat families. If you click the outer ring, the graph view zooms in and displays details about the selected threat.
The legend on the right side of the widget provides a count of the occurrences of the most frequent threats detected. When you point to an item in the legend, a pop-up window gives further information about the threat class, the number of incidents, and the number of affected hosts. Clicking the item zooms the graph view for the selected threat type and provides more contextual information.
