


Traceflow allows you to inject a packet into the network and monitor its flow across the network. This flow allows you to monitor your network and identify issues such as bottlenecks or disruptions.
Traceflow allows you to identify the path (or paths) a packet takes to reach its destination or, conversely, where a packet is dropped along the way. Each entity reports the packet handling on input and output, so you can determine whether issues occur when receiving a packet or when forwarding the packet.
What is Traceflow?
Traceflow is not the same as a ping request/response that goes from guest-VM stack to guest-VM stack. Traceflow observes a marked packet as it traverses the overlay network, and each packet is monitored as it crosses the overlay network until it reaches a destination guest VM or an Edge uplink. Note that the injected marked packet is never actually delivered to the destination guest VM.
Traceflow can be used on transport nodes and supports both IPV4 and IPv6 protocols including: ICMP, TCP, UDP, DHCP, DNS and ARP/NDP.
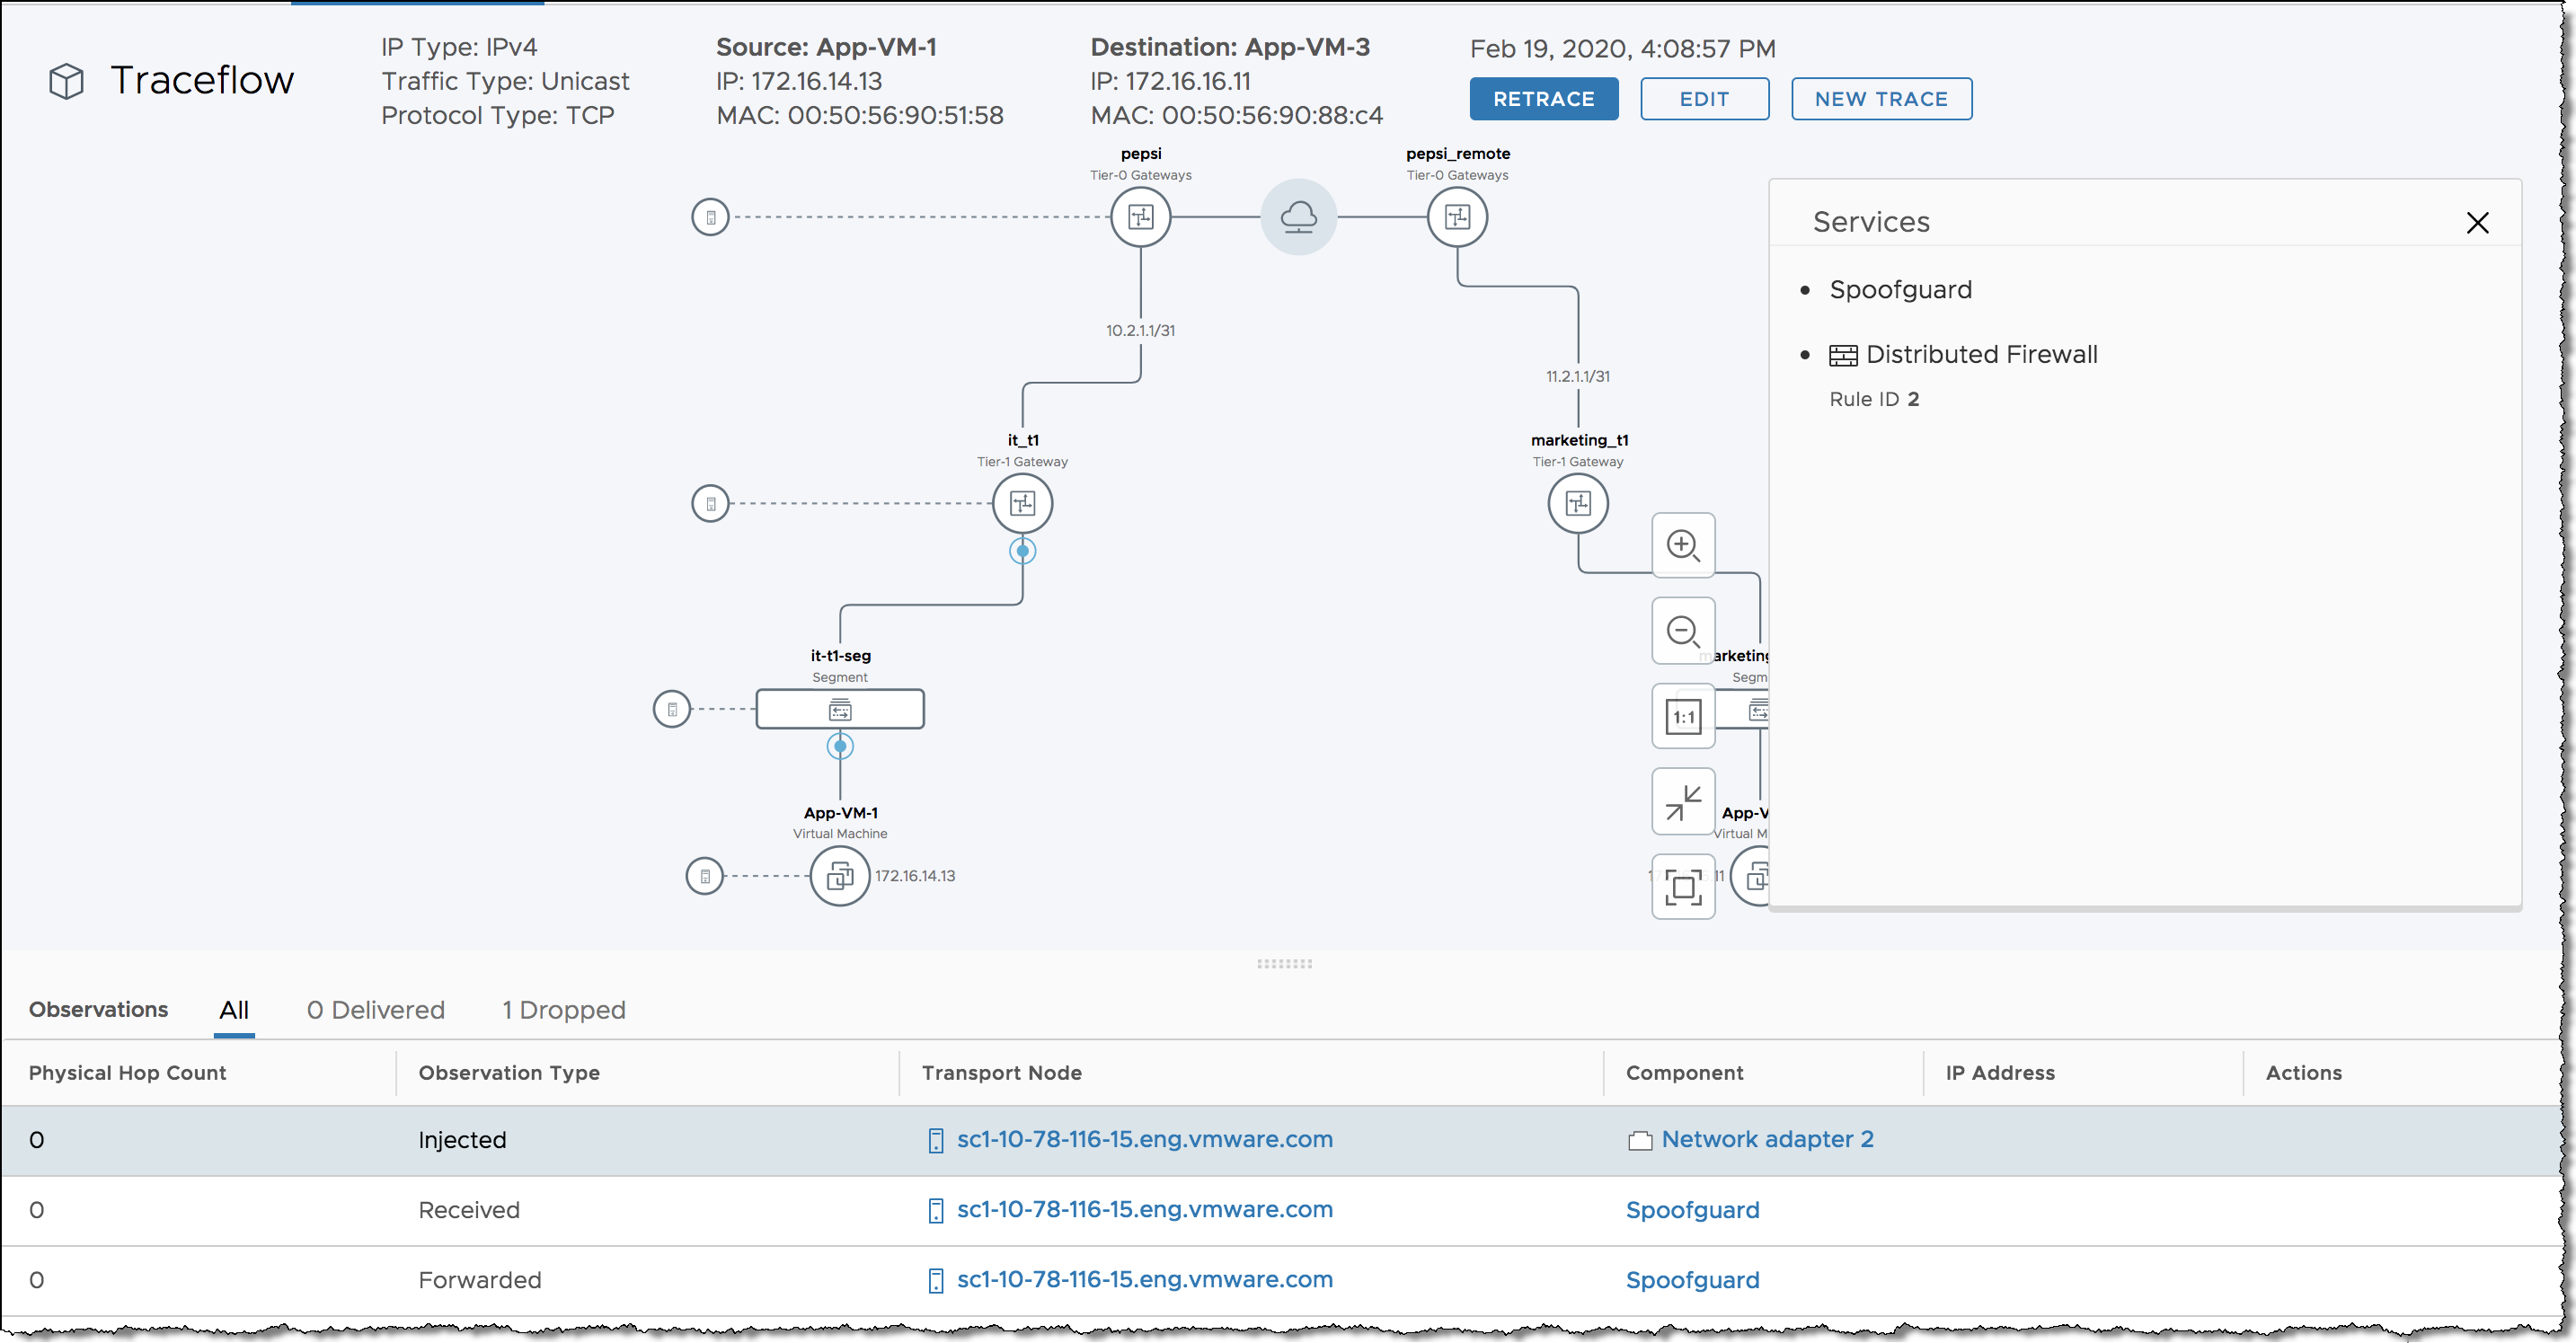
Traceflow Parameters
You can construct packets with custom header fields and packet sizes. The source or destination for the traceflow can be a logical switch port, logical router uplink port, CSP or DHCP port. The destination endpoint can be any device in the NSX overlay or in the underlay. However, you cannot select a destination that is north of an NSX Edge node. The destination must be on the same subnet, or must be reachable through NSX distributed logical routers.
If NSX bridging is configured, packets with unknown destination MAC addresses are always sent to the bridge. Typically, the bridge forwards these packets to a VLAN and reports the traceflow packet as delivered. A packet reported as delivered does not necessarily mean that the trace packet was delivered to the specified destination.
For a unicast traceflow packet, you can observe packet replication and/or flooding in traceflow observations.
- A traceflow packet is replicated if the logical switch does not know the TEP(s) to which the packet is destined.
- A traceflow packet is flooded if VDS does not know the virtual switch port(s) to which the packet is destined.
You can specify multicast and broadcast packets as traceflow packets.
- For multicast traffic, the source is a VM vNIC or a logical port, and the destination is a multicast IP address.
- For broadcast traffic, the source is a VM vNIC or a logical port, and the Layer 2 destination MAC address is FF:FF:FF:FF:FF:FF.
To create a valid packet for firewall inspection, the broadcast traceflow operation requires a subnet prefix length. The subnet mask enables NSX to calculate an IP network address for the packet. A multicast or broadcast traceflow packet can be delivered to multiple VM vNICs or Edge uplinks, resulting in the generation of multiple delivered observations.
