


In a network, latency can accumulate at multiple endpoints in the data path. As a network administrator, you need the ability to monitor the latency of a network to diagnose and troubleshoot performance bottlenecks in the network.
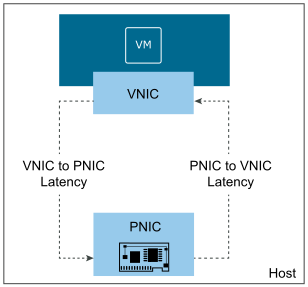
- pNIC to vNIC
- vNIC to pNIC
- vNIC to vNIC
- VTEP to VTEP
- Only ESXi host transport nodes are supported for measuring network latency in the data plane.
- Edge transport nodes are not supported.
- On VLAN segments, network latency is measured only when the two vNICs belong to VMs on the same ESXi host.
- When the VMs are attached to separate segments, network latency is measured only when the data traffic is routed through the distributed router (DR) instance on the ESXi host transport nodes. If the data traffic is routed through the DR instance on the edge transport nodes, network latency is not measured.
- Enhanced networking stack (ENS) does not support vNIC-to-pNIC, pNIC-to-vNIC, or vNIC-to-vNIC latency.
- Latency measurement is not supported when an east-west network traffic protection is configured using partner service VMs. Latency monitoring is disabled on the ports of service virtual machine (SVMs) and guest VMs.
- Latency measurement is not supported on the Data Processing Unit (DPU).
You can export the latency data to external network performance monitoring tools and run analytics on the data. The external monitoring tools are also called collectors. By using a collector, you can achieve greater network visibility, optimize network performance, and identify the endpoints in the data path that cause a significant latency in the network.
After the hosts are configured to measure network latency statistics, the network operations agent (netopa) on the hosts periodically polls the data plane. When latency data is available, the agent exports the data at preconfigured intervals to the external collectors.
- The netopa agent can export the network latency statistics only to Aria Operations for Networks. Other collector tools are not supported currently.
- For VTEP statistics, Aria Operations for Networks 5.0 or later is required. For the pNIC and vNIC statistics, Aria Operations for Networks 5.3 or later is required.
- You can configure ESXi hosts to measure network latency statistics only by using the NSX REST APIs.
You can measure network latency statistics for both standalone ESXi hosts and ESXi hosts that are a part of the VMware vCenter cluster. However, Aria Operations for Networks supports collecting latency statistics only from vCenter-managed ESXi hosts and not from standalone ESXi hosts.
pNIC-to-vNIC and vNIC-to-pNIC Latency
When pNIC latency measurement is enabled on a host transport node, vNIC-to-pNIC latency and pNIC-to-vNIC latency are computed for each vNIC on the host transport node.
pNIC-to-vNIC and vNIC-to-pNIC latency statistics are exported to the external collector in the following format:
Endpoint1, Endpoint2, Max, Min, Avg- Endpoint1, Endpoint2 can either be the virtual interface ID (VIF ID) or the name of the physical adapter on an ESXi host (vmnic).
- Max, Min, and Avg represent the maximum, minimum, and average latency values between the two endpoints in microseconds.
vNIC to vNIC Latency
This latency represents the time taken by the data packet to travel from the source vNIC to the destination vNIC either on the same ESXi host or different ESXi hosts. If the vNICs are on different ESXi hosts, only GENEVE encapsulation protocol is supported in the overlay tunnel between the hosts.

- When the source VNIC1 on VM1 and the destination VNIC2 on VM2 are on the same host, a single-trip latency is calculated for each trip and exported to the collector. In other words, latency for each trip from VNIC1 to VNIC2 and from VNIC2 to VNIC1 is computed separately.
- When the source VNIC1 on VM1 and the destination VNIC2 on VM2 are on different hosts, total round-trip latency is calculated, and only a single latency value is exported to the collector. If there is no return traffic from VNIC2 to VNIC1, no network latency is exported to the collector.
vNIC-to-vNIC latency statistics are exported to the external collector in the following format:
VIF1, VIF2, Max, Min, Avg- VIF1, VIF2 represent the virtual interfaces or the vNICs.
- Max, Min, and Avg represent the maximum, minimum, and average latency values between the two vNICs in microseconds.
VTEP-to-VTEP Latency
This latency represents the total round-trip time taken by the data packet to travel from the source VTEP to the destination VTEP. To measure VTEP-to-VTEP latency, you must enable latency in the transport zone profile.
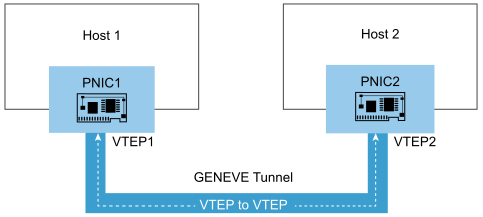
To calculate the VTEP-to-VTEP latency between ESXi hosts, Bidirectional Flow Detection (BFD) protocol is used. NSX extends the BFD protocol with timestamps in the payload to support latency computation between the VTEPs. BFD packets are transmitted at regular intervals in each tunnel between the hosts to compute the VTEP-to-VTEP latency.
