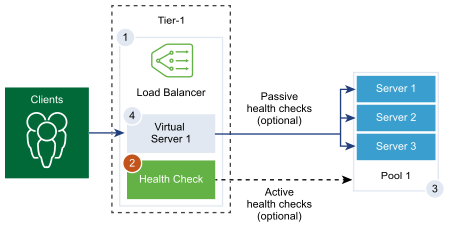
The active health monitor is used to test whether a server is available. The active health monitor uses several types of tests such as sending a basic ping to servers or advanced HTTP requests to monitor the application health.
Servers that fail to respond within a certain time period or respond with errors are excluded from future connection handling until a subsequent periodic health check finds these servers to be healthy.
Active health checks are performed on server pool members after the pool member is attached to a virtual server and that virtual server is attached to a Tier-1 gateway (previously called a Tier-1 logical router).
If the Tier-1 gateway is connected to a Tier-0 gateway, a router link port is created and its IP address (typically in the 100.64.x.x format) is used to perform the health check for the load balancer service. If the Tier-1 gateway is standalone (has only one centralized service port and is not connected to a Tier-0 gateway), the centralized service port IP address is used to perform the health check for the load balancer service. See Create a Standalone Tier-1 Logical Router in Manager Mode for information about standalone Tier-1 gateways.
Note: More than one active health monitor can be configured per server pool.

Procedure
- With admin privileges, log in to NSX Manager.
- Select .
- Enter a name and description for the active health monitor.
- Select a health check protocol for the server from the drop-down menu.
You can also use predefined protocols in
NSX Manager;
http-monitor,
https-monitor,
Icmp-monitor,
Tcp-monitor, and
Udp-monitor.
- Set the value of the monitoring port.
- Configure the values to monitor a service pool.
You can also accept the default active health monitor values.
| Option |
Description |
| Monitoring Interval |
Set the time in seconds that the monitor sends another connection request to the server. |
| Fall Count |
Set a value when the consecutive failures reach this value, the server is considered temporarily unavailable. |
| Rise Count |
Set a number after this timeout period, the server is tried again for a new connection to see if it is available. |
| Timeout Period |
The time the health check probe waits for a response before it is considered failed. |
For example, if the monitoring interval is set as 5 seconds and the timeout as 15 seconds, the load balancer send requests to the server every 5 seconds. In each probe, if the expected response is received from the server within 15 seconds, then the health check result is OK. If not, then the result is CRITICAL. If the recent three health check results are all UP, the server is considered as UP.
- If you select HTTP as the health check protocol, complete the following details.
| Option |
Description |
| HTTP Method |
Select the method for detecting the server status from the drop-down menu, GET, OPTIONS, POST, HEAD, and PUT. |
| HTTP Request URL |
Enter the request URI for the method. ASCII control characters (backspace, vertical tab, horizontal tab, line feed, etc), unsafe characters such as a space, \, <, >, {, }, and any character outside the ASCII character set are not allowed in the request URL and should be encoded. For example, replace a space with a plus (+) sign, or with %20. |
| HTTP Request Version |
Select the supported request version from the drop-down menu. You can also accept the default version, HTTP_VERSION_1_1. |
| HTTP Request Body |
Enter the request body. Valid for the POST and PUT methods. |
| HTTP Response Code |
Enter the string that the monitor expects to match in the status line of HTTP response body. The response code is a comma-separated list. For example, 200,301,302,401. |
| HTTP Response Body |
If the HTTP response body string and the HTTP health check response body match, then the server is considered as healthy. |
- If you select HTTPs as the health check protocol, complete the following details.
- Select the SSL protocol list.
TLS 1.2 and TLS 1.3 versions are supported and activated by default. TLS1.1 is supported, but deactivated by default.
- Click the arrow and move the protocols into the selected section.
- Assign a default SSL cipher or create a custom SSL cipher.
- Complete the following details for HTTP as the health check protocol.
| Option |
Description |
| HTTP Method |
Select the method for detecting the server status from the drop-down menu: GET, OPTIONS, POST, HEAD, and PUT. |
| HTTP Request URL |
Enter the request URI for the method. ASCII control characters (backspace, vertical tab, horizontal tab, line feed, etc), unsafe characters such as a space, \, <, >, {, }, and any character outside the ASCII character set are not allowed in the request URL and should be encoded. For example, replace a space with a plus (+) sign, or with %20. |
| HTTP Request Version |
Select the supported request version from the drop-down menu. You can also accept the default version, HTTP_VERSION_1_1. |
| HTTP Request Body |
Enter the request body. Valid for the POST and PUT methods. |
| HTTP Response Code |
Enter the string that the monitor expects to match in the status line of HTTP response body. The response code is a comma-separated list. For example, 200,301,302,401. |
| HTTP Response Body |
If the HTTP response body string and the HTTP health check response body match, then the server is considered as healthy. |
- If you select ICMP as the health check protocol, assign the data size in byte of the ICMP health check packet.
- If you select TCP as the health check protocol, you can leave the parameters empty.
If both the sent and expected are not listed, then a three-way handshake TCP connection is established to validate the server health. No data is sent. Expected data if listed has to be a string and can be anywhere in the response. Regular expressions are not supported.
- If you select UDP as the health check protocol, complete the following required details.
| Required Option |
Description |
| UDP Data Sent |
Enter the string to be sent to a server after a connection is established. |
| UDP Data Expected |
Enter the string expected to receive from the server. Only when the received string matches this definition, is the server is considered as UP. |
- Click Finish.
What to do next
Associate the active health monitor with a server pool. See Add a Server Pool for Load Balancing in Manager Mode.
