The troubleshooting dashboard lets you view the status of pods, services, and volumes in the underlying infrastructure to identify errors.
You can also run diagnostics to troubleshoot an error or download error logs to attach to a support request.
Procedure
- From your browser, log in with Admin privileges to NSX Application Platform Automation Appliance at https://<nsx-application-platform-automation-ip-address>.
- On the Troubleshooting page, click Start.
- From the drop-down menu, select the newly created instance to troubleshoot.
- On the Pods tab, click Get Pods Status.
The status of the underlying pods appears.
- On the Services tab, click Get Services Status.
The status of the running services and associated clusters and ports appears.
- On the Volumes tab, click Get Volumes Status.
The status of the storage volumes and associated capacity and volume appears.
- On the Logs tab, select Download Log File.
Download the generated error log file and troubleshoot or share the file with the VMware support team.
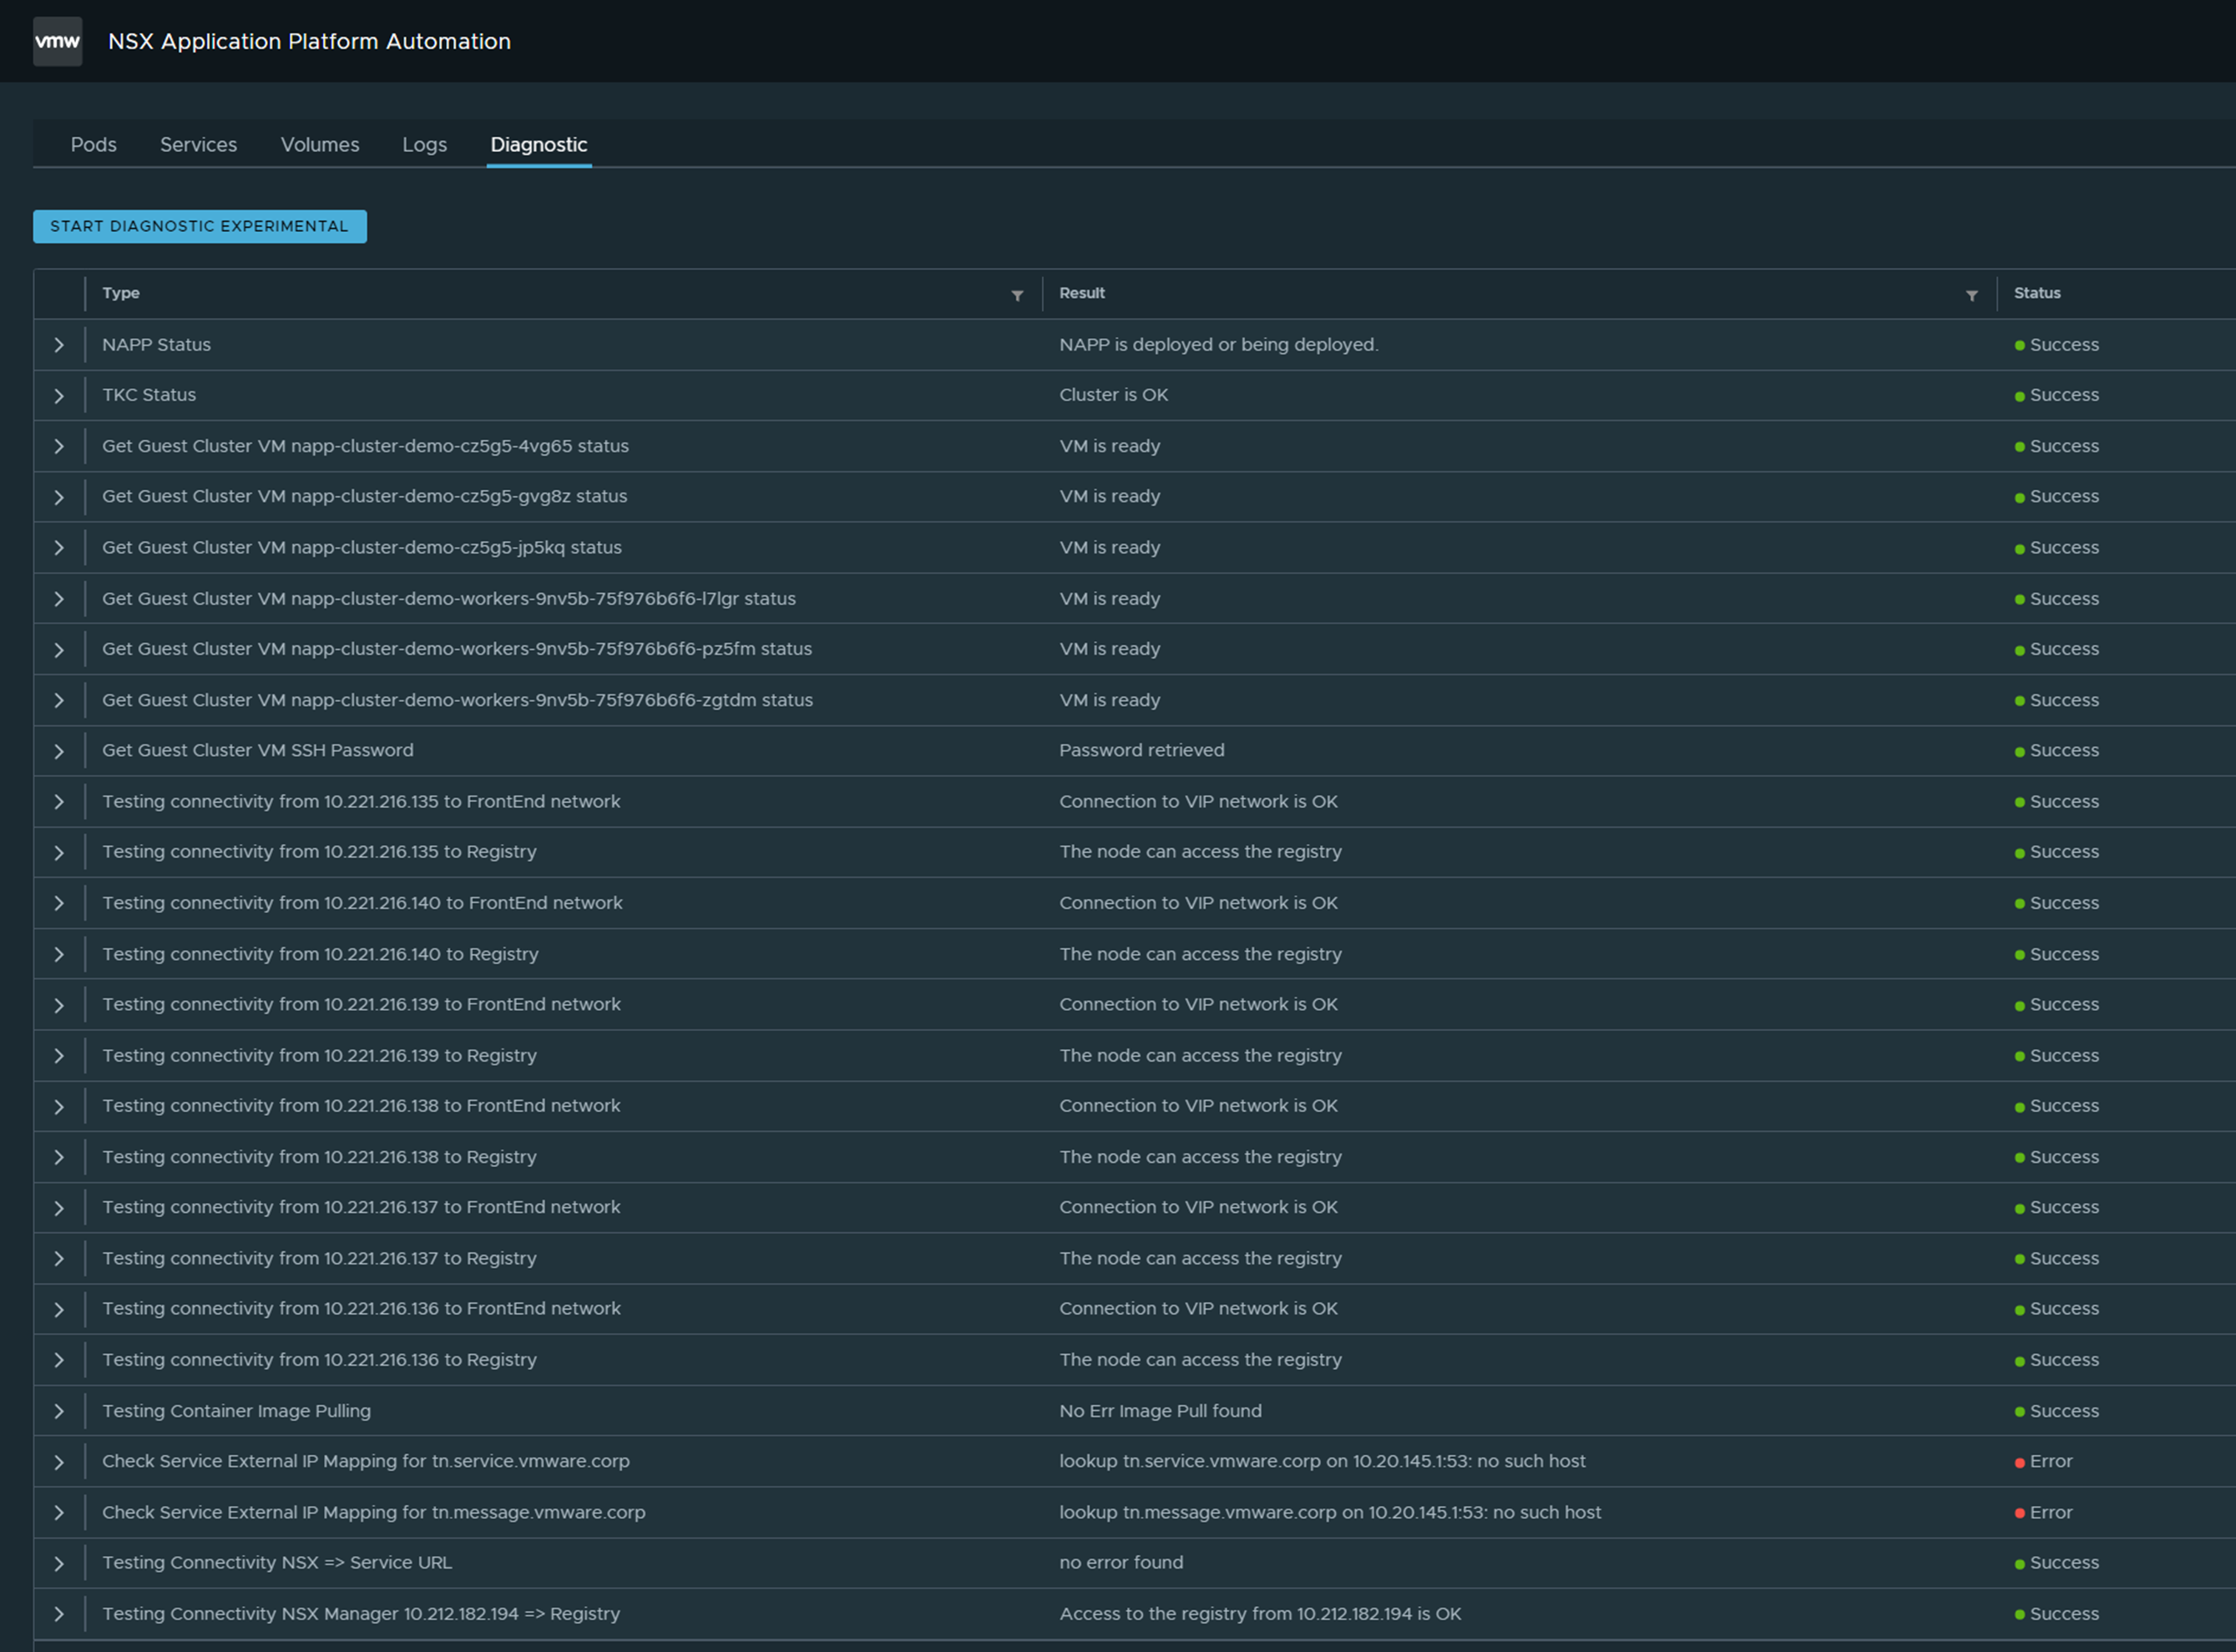
- On the Diagnostic tab, click Start Diagnostics.
The diagnostics process retrieves the status of the
NSX Application Platform,
Tanzu Kubernetes Grid, and
NSX Manager.
If you see an error status, expand the status, and read the error description details.