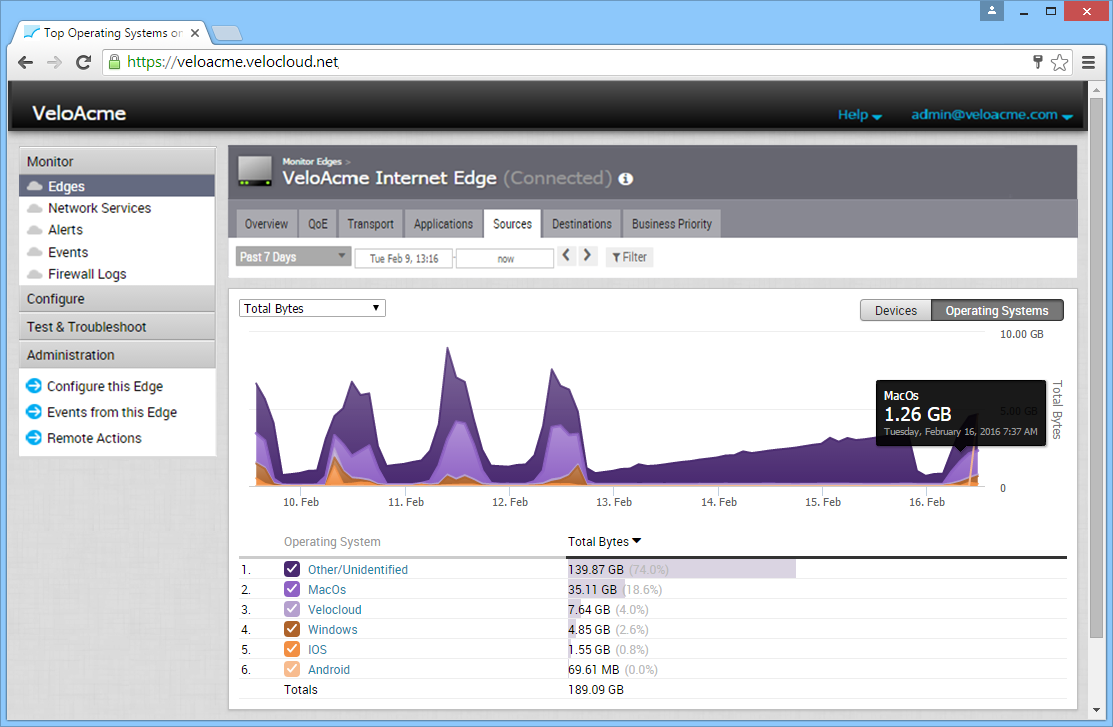
The Edge Sources tab screen displays network usage data (operating system, device type) over a historical period of time.
The data is displayed as two line graphs. You can change the data that is displayed in the graphs from the Data drop-down menu (Bytes Received/Sent, Total Bytes, Total Packets, or Packets Received/Sent). You can also hover over a segment of the graph to display the source and its associated network usage.
In the Sources tab screen (below image), you can:
- View the operating systems of your applications and destinations in the Operating Systems column (located at the bottom of the screen).
- Use Filter to display operating systems based on Application, Category, type of Operating System, and Destination.
- Click an operating system from the Operating System column to open the Top Operating Systems dialog box.
- Go to the Applications tab by clicking the gray arrow next to the Top Applications area of the Top Operating Systems dialog box.
- Go to the Destinations tab by clicking the gray arrow next to the Top Destinations area of the Top Operating Systems dialog box.
