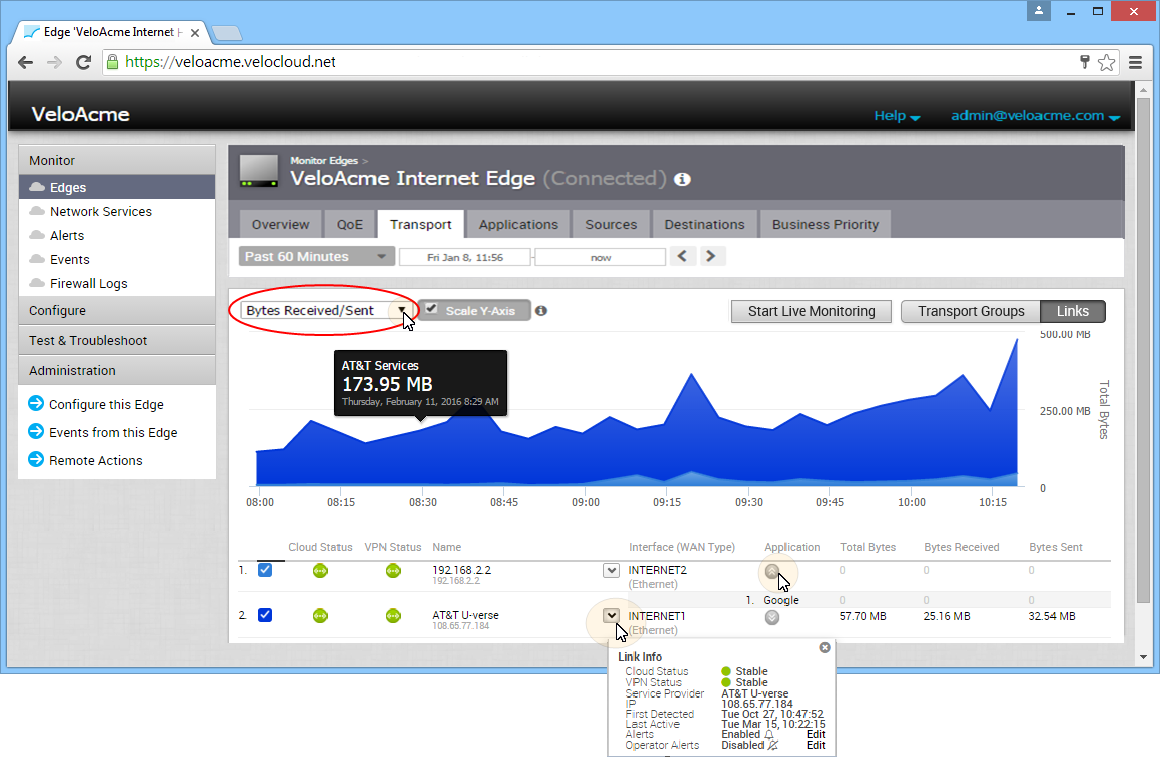
The Edge Transport tab provides an overview of the bandwidth used across all of the WAN links. You can hover over the line graph and view Sent and Received data in a pop-up window.
For any point in time, you can view which Link or Transport Group was used for the traffic and how much data was sent. See the sections below for a description of the major areas of the Transport tab.

Links
When you click the Transport tab, Links is the default display screen (as shown in the image above). The Links screen displays Sent and Received data for your links. Any links associated with an Edge are displayed in a numbered list at the bottom of the screen under the Link column, along with their Interface (WAN Type) and Total Bytes. See image above.
The Links screen appears:
- Status for Cloud and VPN ( green: connected, red: disabled, gray: unavailable)
- Link Info (you can access this pop-up window by clicking the down arrow next to Interface WAN Type)
- Applications (click the gray arrow underneath the Application column)
Links Stats Menu
The Links Stats menu is located next to the Scale Y-Axis checkbox at the top left side of the Transport tab screen (as shown in the image above). Descriptions for the options listed in the Links Stats drop-down menu are described in the following table.
| Link Stat Item | Definition |
|---|---|
| Bandwidth | This parameter denotes the desired bandwidth allocation in Mbps for each flow. Based on these parameters, the total capacity is allocated in proportion to the bandwidth values of various flows. |
| Jitter | Jitter is calculated using the RFC 3550 Formula for calculating jitter that is used by RTP. |
| Latency | For each packet, the latency is measured by subtracting the network send time (packet is time stamped immediately before being sent) from the network receive time (packet is time stamped immediately after being received). |
| Packet Loss | A lost packet is calculated when a path sequence number is missed and doesn’t arrive within the re-sequencing window. A “very late” packet is counted as a lost packet in this regard. |
Live Monitoring
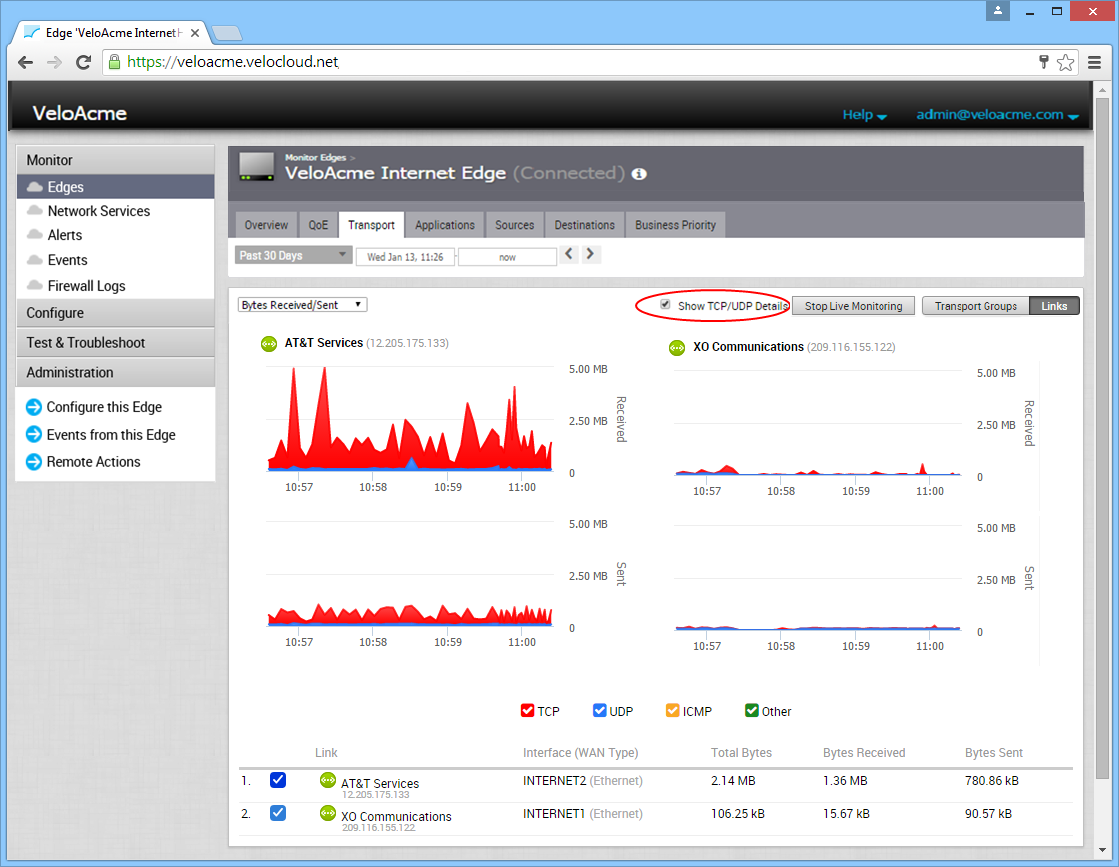
Live monitoring is useful for conducting active testing and calculating Average Throughput. It is also beneficial for troubleshooting security compliance and for seeing how traffic policies are being leveraged in real time.
To monitor live traffic for Links and Transport Groups click the Start Live Monitoring button. When the Live Monitoring screen appears, select the Show TCP/UDP Details checkbox to view protocol level link usage details.

Transport Groups
Transport Groups are links grouped into one of the following categories:
- Public Wired
- Private Wired
- Public Wireless
Transport Groups enable box-by-box configuration and business policy abstraction. A single plan can be applied across different hardware agnostic types. When you click the Transport Groups button, the above items are displayed in a numbered list in the Transport Group area at the bottom of the Transport screen.
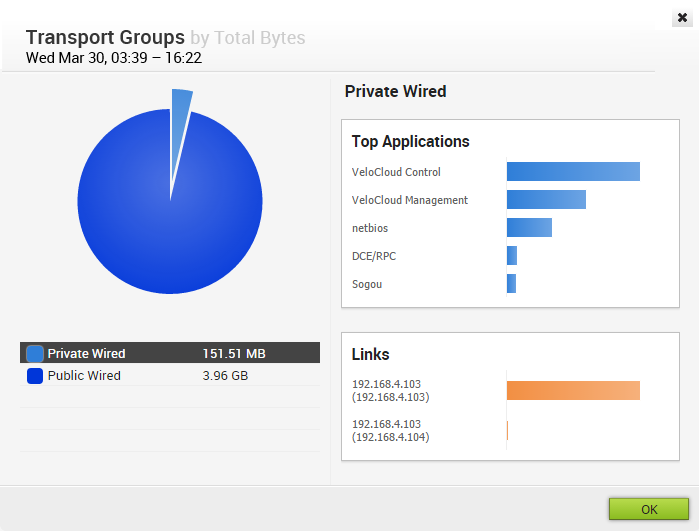
You can also click the Transport Group link to view the data for that group. See the section below (Viewing Links in a Transport Group) for information about the Transport Groups dialog box.
View Links in a Transport Group
In addition to viewing Transport Group data (within the line graph), you can also view the specific links in your Transport Group.
To view links in a Transport Group:
- Click the Transport Groups button.
Transport Groups are displayed in a numbered list at the bottom of the Transport tab.
- Click a Transport Group link (Public Wired, Private Wired, or Public Wireless).
The Transport Groups dialog box appears.

- Click a Transport Group from the Pie chart to display the top applications and links within a Transport Group. (You can also toggle between Transport Groups by clicking the Transport Group categories displayed below the Pie chart).
- Click OK to exit the dialog box.