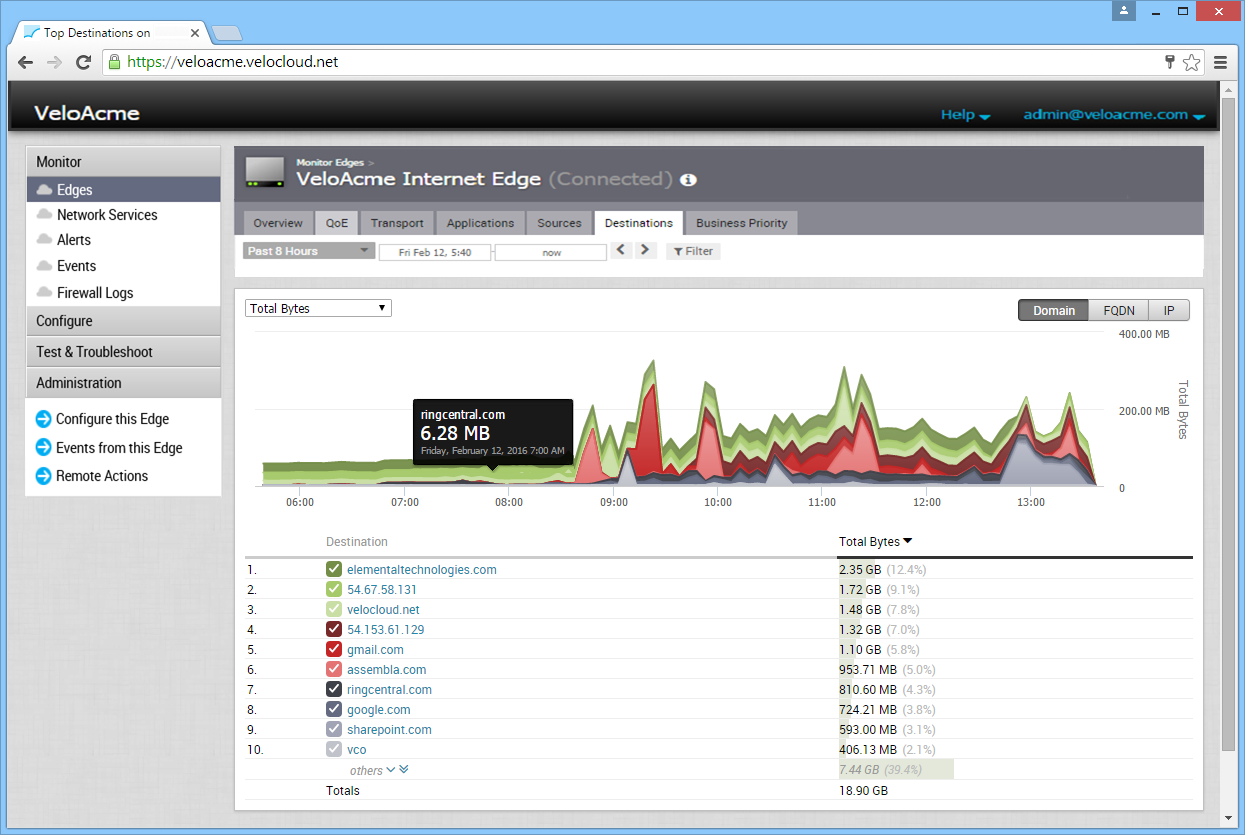
The Edge Destinations tab displays network usage as two line graphs (over a historical period of time) by the destination of the network traffic. If you hover over a segment of the graph, the destination and its associated network usage appears.
There are three display buttons (Domain, FQDN, and IP) located on the right side of the screen. Click one of the display buttons to update destinations by type in the Destination column.
For each display button (Domain, FQDN, and IP), the Top Destinations dialog box appears by type when you click a destination from the Destination column. You can open the Applications and Sources tabs from the Top Destinations dialog box. Click the gray arrows next to the Top Applications and Top Operating areas of the dialog boxes (respectively) to open these tabs.
