


You can view the details of Gateways connected to a specific Edge.
To view the Gateways:
Procedure
- In the Enterprise portal, click the Open New Orchestrator UI option available at the top of the Window.
- Click Launch New Orchestrator UI in the pop-up window. The UI opens in a new tab displaying the monitoring options.
- Click Edges to view the Edges associated with the Enterprise.
- Click the link to an Edge and click the Gateways tab.
Results
The Gateways tab displays the details of the Gateways connected to the selected Edge.
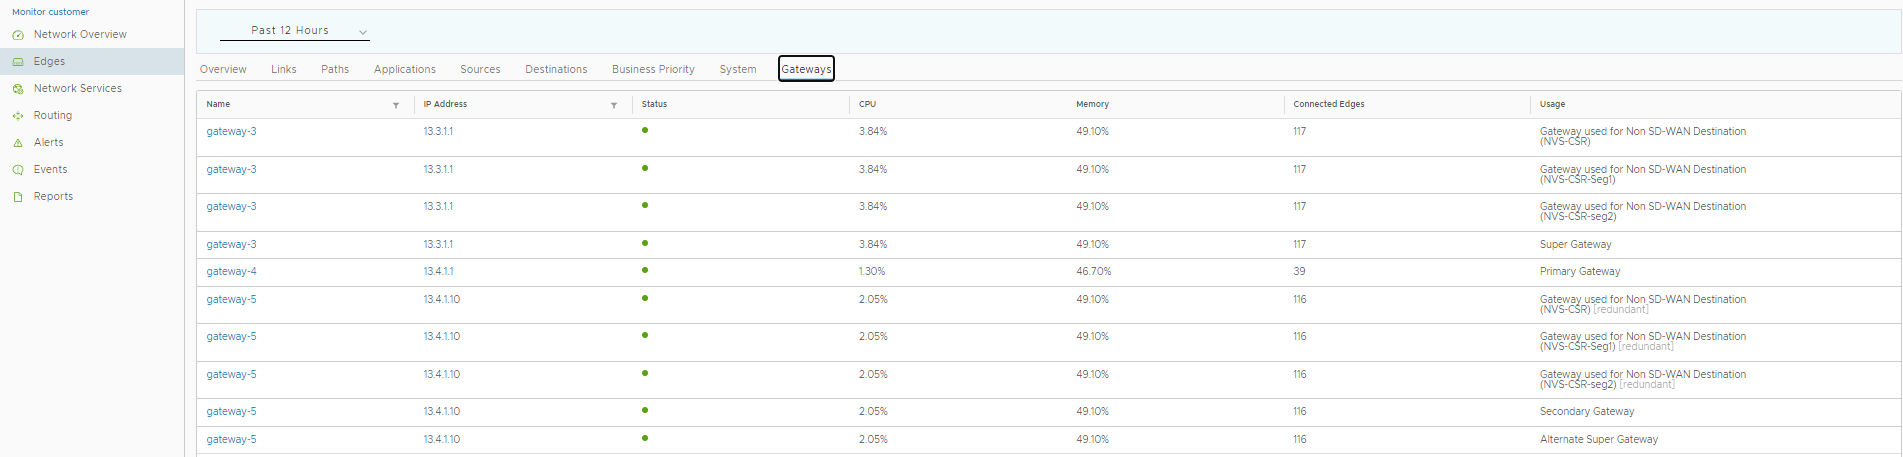
At the top of the page, you can choose a specific time period to view the details of the connected Gateways for the selected duration.
The page displays the following details:
- Name – Name of the Gateway. Click the link to a name to view more details of the Gateway.
- IP Address – IP address of the Gateway.
- Status – Service state of the Gateway. The state may be one of the following: In Service, Out of Service, or Quiesced.
- CPU – Percentage of CPU utilization by the Gateway.
- Memory – Percentage of memory utilization by the Gateway.
- Connected Edges – Number of Edges connected to the Gateway.
- Usage – Description of how the Gateway is used in the network.
You can also sort the report by clicking the header of each column. You can use the Filter Icon displayed next to the header to filter the details by specific Gateway name or IP address.
