Path is a tunnel between two endpoints. Path visibility is a report on utilization and quality of the paths between an Edge and its SD-WAN peers. SD-WAN Orchestrator enables an Enterprise user to monitor the Path visibility using the monitoring dashboard.
For a selected Edge, you can monitor the Path information for the SD-WAN peers with traffic flow observed for a specific period.
Procedure
- In the Enterprise portal, click the Open New Orchestrator UI option available at the top of the Window.
- Click Launch New Orchestrator UI in the pop-up window. The UI opens in a new tab displaying the monitoring options.
- Click Edges to view the Edges associated with the Enterprise.
- Click the link to an Edge and click the Paths tab.
Results

At the top of the page, you can choose a specific time period to view the path information for the edge.
To get a report of an SD-WAN peer in CSV format, select the SD-WAN peer and click Export Path Statistics.
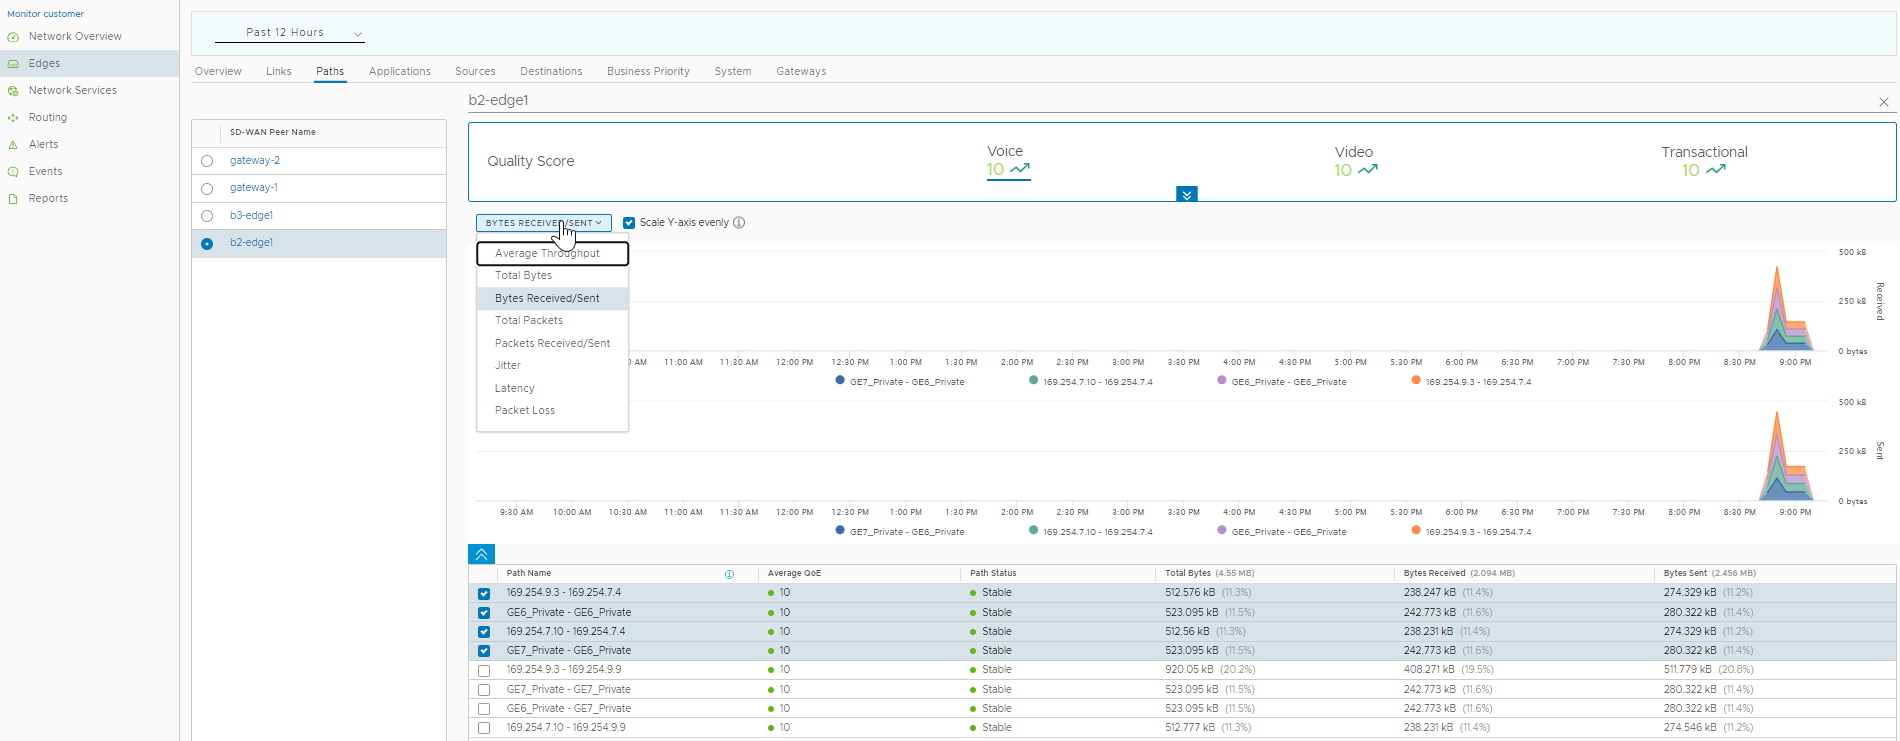
Click the link to an SD-WAN peer to view the corresponding Path details as follows:
- All the SD-WAN peers that have traffic observed during the selected time period
- The status of the paths available for a selected peer
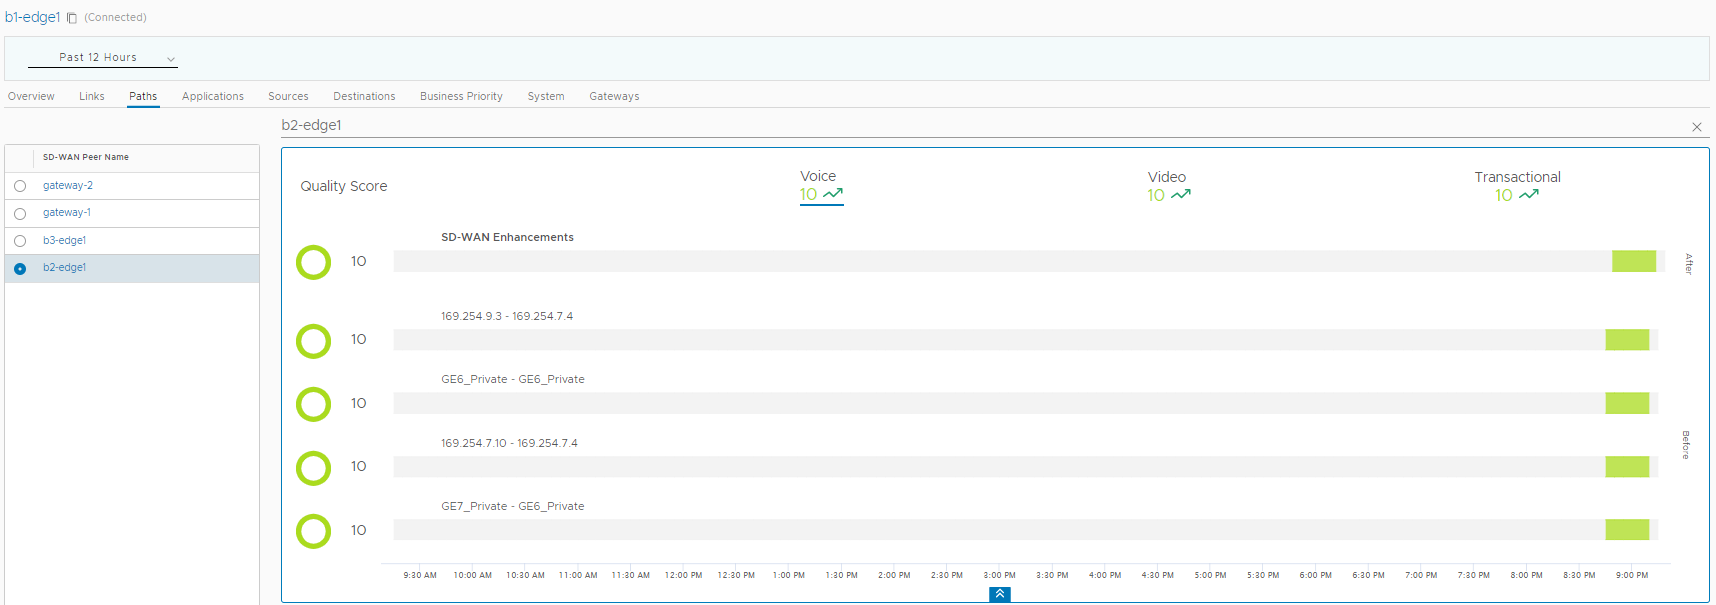
- Overall Quality score of the paths for a selected peer for video, voice, transactional traffic
- Time series data for each path by metrics like: Throughput, Latency, Packet loss, Jitter, and so on. For more information on the parameters, see Monitor Edges.

The metrics time-series data is displayed in graphical format. You can select and view the details of a maximum of 4 paths at a time.
Hover the mouse on the graphs to view more details.
You can choose the metrics from the drop-down list to view the corresponding graphical information. By default the Scale Y-axis evenly checkbox is enabled. This option synchronizes the Y-axis between the charts. If required, you can disable this option.
Click the DOWN arrow in the Quality Score pane at the top, to view the Path score by the traffic types.

You can click an SD-WAN peer displayed at the left pane to view the corresponding Path details.