


You can generate a Quick report using the default values or a custom report with specified values. You can also schedule a custom report to run on a recurring basis. All the reports are displayed in the Reports page, where you can download and view the report data. You can also view the scheduled reports in this page.
In the new Orchestrator UI, click Reports. The page displays all the generated reports.
To download a report, click the Completed link of the report. The report downloads as a ZIP file, which consists of the PDF format of the report. If you have configured to export the report to CSV format, the ZIP file consists of both the PDF and CSV files.
- PDF:
- Graphical representation of distribution of Enterprise Traffic, Transport, and top Applications.
- Top 10 Applications by Traffic and Transport types.
- Top 10 Edges by Applications.
The following image shows an example snippet of a PDF report:
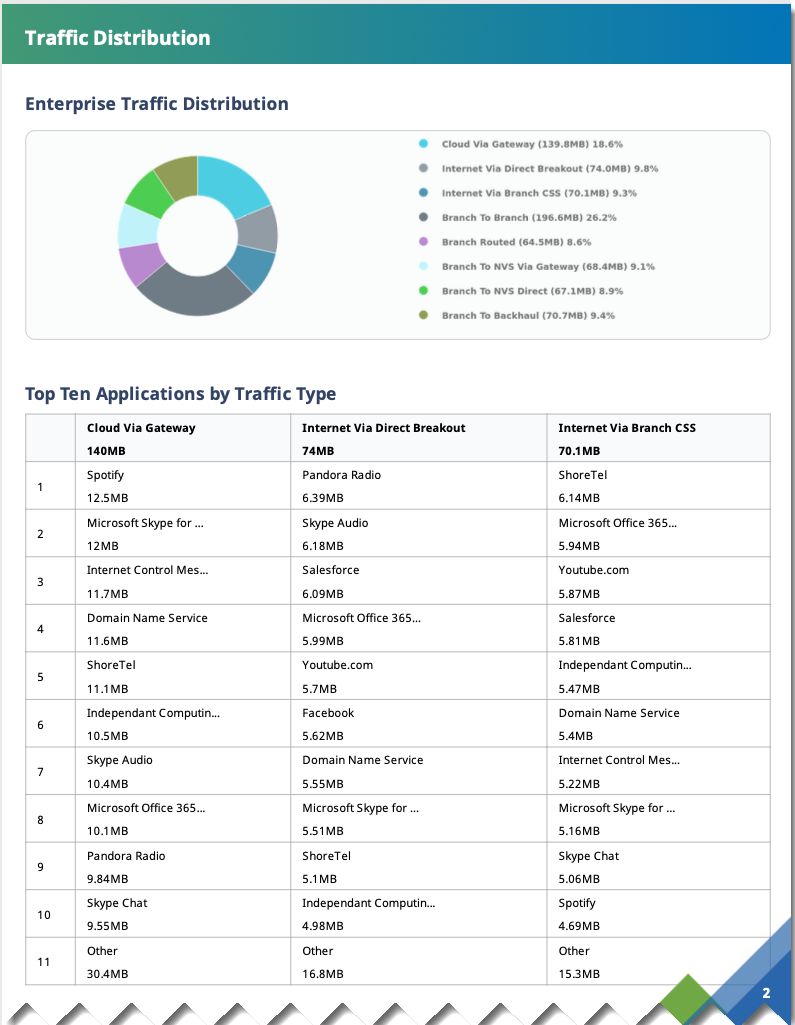 The Enterprise Traffic distribution lists the following data:
- Cloud Via Gateway: Internet bound traffic that goes through the SD-WAN Gateway.
- Internet Via Direct Breakout: Internet bound traffic that breaks out directly from branch and does not go through VMware Tunnels.
- Internet Via Branch CSS: Traffic bound to Cloud Security Services directly from VMware branch.
- Branch To Branch: Traffic going through SD-WAN Gateway / SD-WAN Hub / dynamic SD-WAN Tunnels, directly between two VMware branches.
- Branch Routed: Traffic bound to local connected / static / routed (underlay) destinations.
- Branch To NVS Via Gateway: Traffic bound from branch to Non VMware SD-WAN Site through SD-WAN Gateway.
- Branch To NVS Direct: Traffic bound from branch to Non VMware SD-WAN Site over direct IPsec tunnels.
- Branch To Backhaul: Internet bound traffic being backhauled from branch to VMware SD-WAN Hubs.
- CSV: The following CSV files are downloaded.
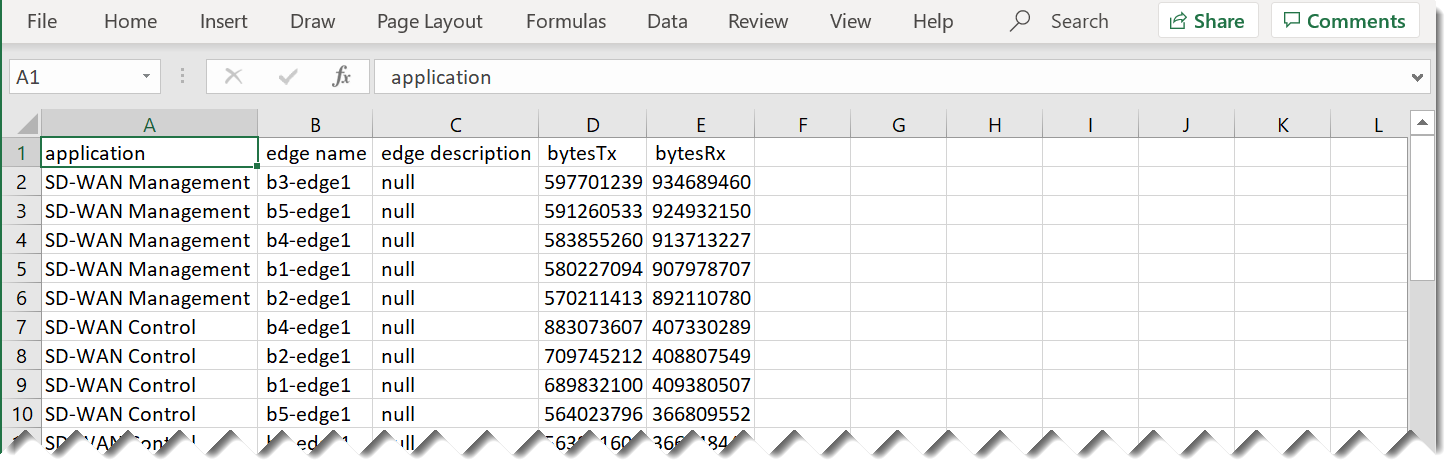
- Top Sites by Applications: Lists all the applications, Edge name, Edge description, Bytes transmitted, and Bytes received.
- Traffic Type: Lists all the flow paths, applications, Edge name, Edge description, Bytes transmitted, and Bytes received.
- Transport Type: Lists all the Transport types, applications, Edge name, Edge description, Bytes transmitted, and Bytes received.
The following image shows an example snippet of a CSV report for Top Sites by Applications:
To delete a report, select the report and click DELETE.
To view the scheduled reports, click SCHEDULED REPORTS.
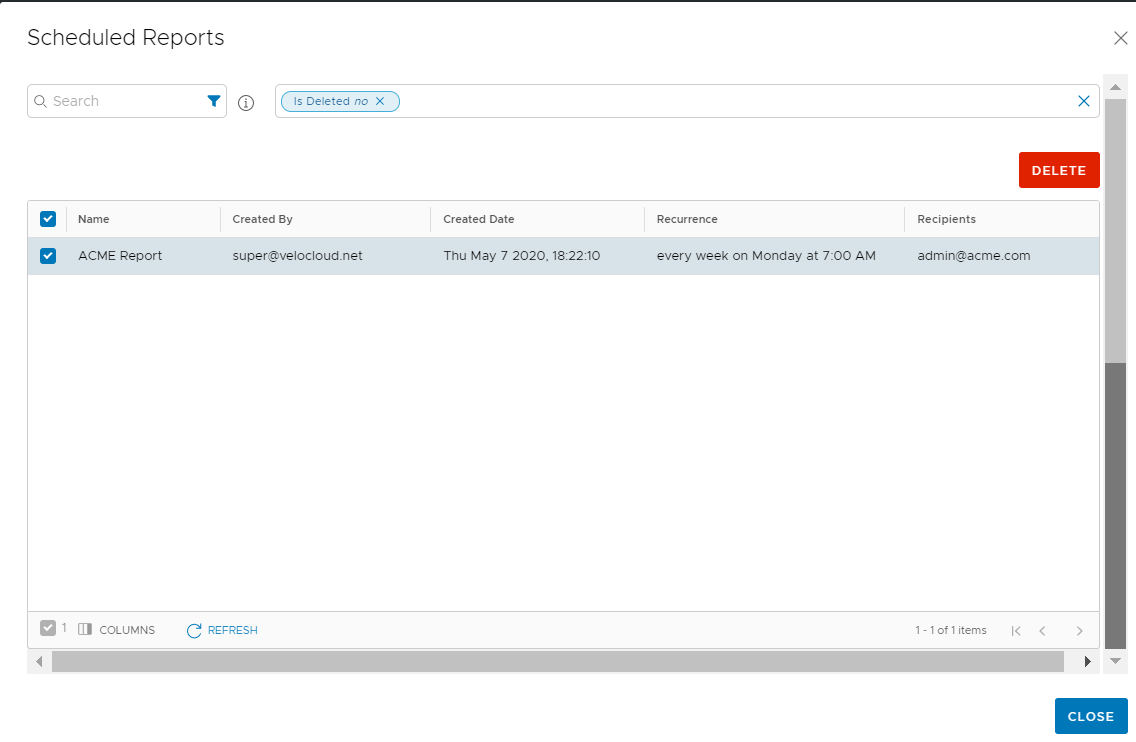
The Scheduled Reports window displays the details of reports and the schedule.
To remove a report from the schedule, select the report and click DELETE.
