


The Network Overview feature helps to monitor networks by checking the Edge and Link (activated Edge) status summary. Clicking Monitor > Network Overview in the navigation panel opens the Network Overview screen, which provides a visual summary about the enterprises running SD-WAN Edge devices, Non VMware SD-WAN Sites, profiles, segments, software versions, and their system configuration time and run time statuses.
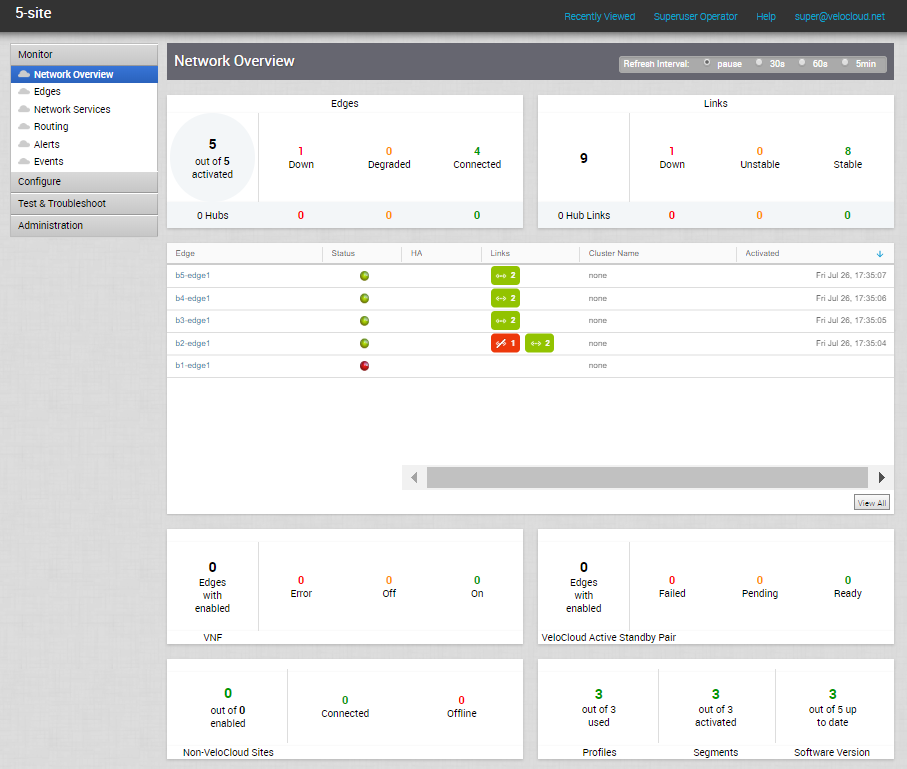
- SD-WAN Edge statistics - Includes the following information about the Edges and Links:
- Total number of Edges
- Total number of Edge Hubs
- Total number of Links
- Total number of Hub Links
- Count of Edges/Edge Hubs (Connected, Degraded, and Down)
- Count of Link/Hub Links (Stable, Unstable, and Down)
- Summary dashboard table - Includes a table that displays top ten Edges, or Edge Hubs, or Links, or Hub Links sorted by last contact time, based on the selected filter criteria in the SD-WAN Edge statistics section.
- Non-Edge statistics - Includes the following non-edge related information:
- Total number of Virtual Network Functions (VNFs)-enabled Edges
- Count of VNFs-enabled Edges (Error, On, and Off)
- Total number of VMware Active Standby Pair-enabled Edges
- Count of VMware Active Standby Pair-enabled Edges (Failed, Pending, and Ready)
- Total number of enabled Non VMware SD-WAN Sites
- Count of Non VMware SD-WAN Sites (Connected and Offline)
- Count of used Profiles out of the total number of Profiles configured for the Enterprise.
- Count of activated Segments out of the total number of Segments configured for the Enterprise.
- Count of Edges with up-to-date Software version out of the total number of Edges configured for the Enterprise.
Note: The minimum supported edge version is 2.4.0. You can change the target edge version against which the edges will be compared by using the system property
product.edge.version.minimumSupported.
You can also get detailed information on a specific item in the Network Overview screen by clicking the link on the respective item or metric. For example, clicking the Edge link in the summary dashboard table takes you to the Edge detail dashboard for the selected Edge.
- pause
- 30s
- 60s
- 5min
SD-WAN Edge States and Transitions
Transitions are driven by Edge heartbeats (which occur under normal circumstances every 30 seconds), irrespective of the Links over which the hearbeats are received.
The following table describes the connection state types and transitions for a SD-WAN Edge.
| Color | Edge State | Description |
|---|---|---|
| Green | Connected |
|
| Amber | Degraded |
|
| Red | Offline | An Edge is in Offline state if the Edge is unable to reach the Orchestrator due to some persistent network condition. |
SD-WAN Orchestrator Link States and Transitions
- Edge-reported Link Stats values as received when the Edge pushes the Link Stats to the Orchestrator (occurs every 5 minutes).
- Edge-reported Events as received by Edge heartbeats (occurs every 30 seconds).
The following table describes the connection state types and transitions for a SD-WAN Orchestrator Link.
| Color | Edge State | Description |
|---|---|---|
| Green | Stable | A Link is in Stable state if the Link conditions appear to be stable and the Orchestrator receives the Link Stats consistently. |
| Amber | Unstable | A Link is in Unstable state if an expected Link Stats push is not received, or Link is down, but has not yet been inactive for 10 minutes. |
| Red | Disconnected | A Link is in Disconnected state if the Link has been inactive for more than 10 minutes. |
