You can monitor the status and network usage data of Gateways available in the Operator portal.
To monitor the Gateways:
Procedure
- In the Operator portal, click the Open New Orchestrator UI option available at the top of the Window.
- Click Launch New Orchestrator UI in the pop-up window. The UI opens in a new tab displaying the monitoring options.
- Click Gateways .
Results
The Gateways page displays the list the available Gateways.

Click Map Distribution to expand and view the locations of the Gateways in the Map. By default, this view is collapsed.
You can also click the arrows prior to each Gateway name to view more details.
The page displays the following details:
- Name – Name of the Gateway.
- Status – Current status of the Gateway. The status may be one of the following: Connected, Degraded, Disabled, Never Activated, Offline, Out of Service, or Quiesced.
- CPU – Percentage of CPU utilization by the Gateway.
- Memory – Percentage of memory utilization by the Gateway.
- Edges – Number of Edges connected to the Gateway.
- Service State – Service state of the Gateway. The state may be one of the following: Historical, In Service, Out of Service, Pending Service, or Quiesced.
- IP Address – The IP Address of the Gateway.
- Location – Location of the Gateway.
Click the link to a Gateway to view the details of the selected Gateway.

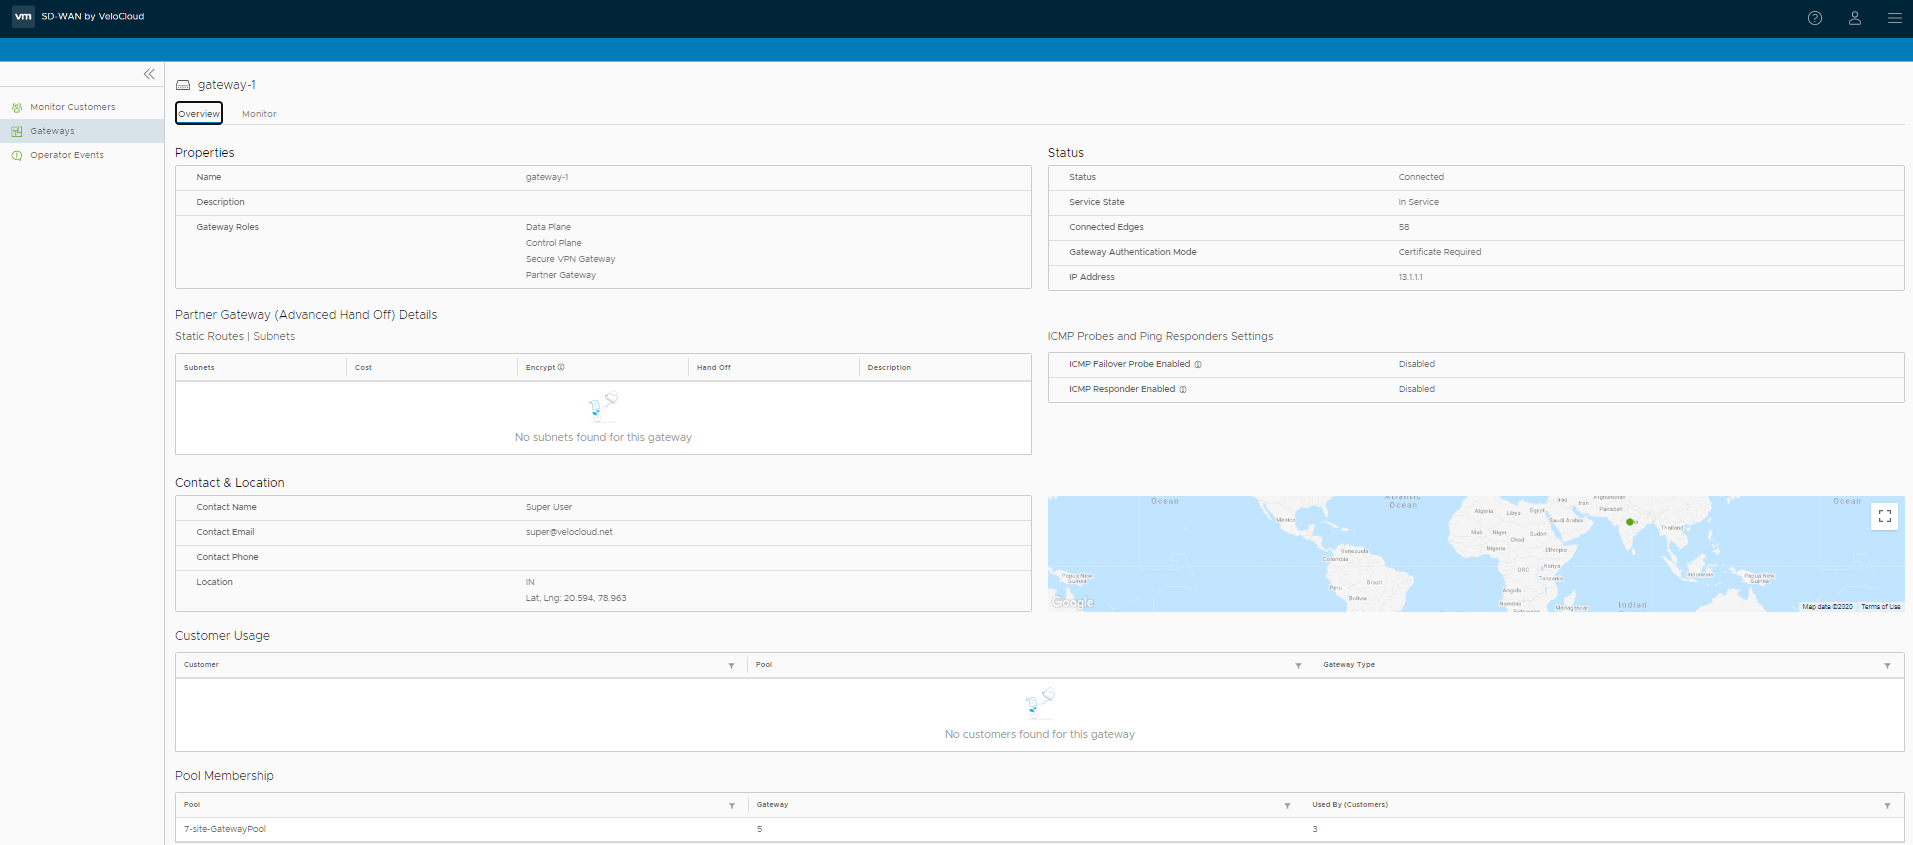
The Overview tab displays the properties, status, location, customer usage, and Gateway pool of the selected Gateway.
Note: You can only view the Gateway details, using this tab. To configure the Gateway information, navigate to the
Gateways page in the Operator portal.
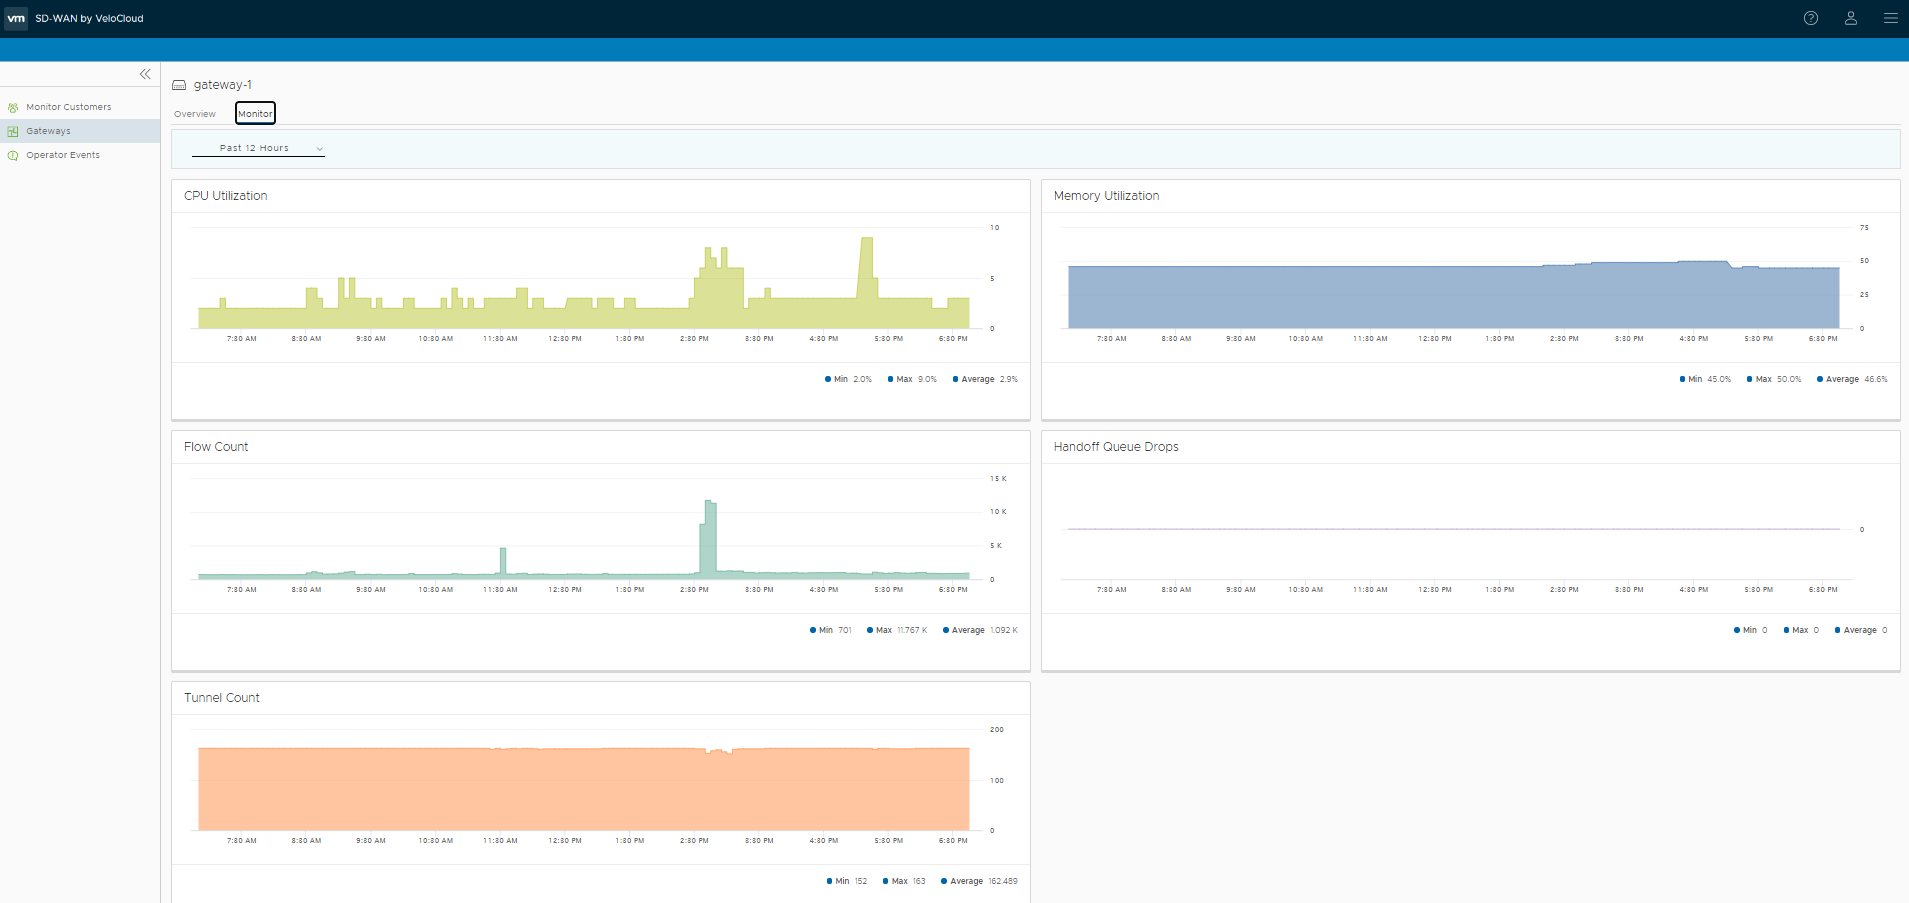
Click the Monitor tab to view the usage details of the selected Gateway.

For more information on the data displayed, see Monitor Gateways.