Once a SD-WAN Edge is provisioned with Analytics, the Analytics functionality collects data (application-specific Analytics or application and branch Analytics). The collected Analytics data are then sent directly from the SD-WAN Edge to the Cloud Analytics Engine. Operator Super User, Operator Standard Admin, Enterprise Super User, Enterprise Standard admin, Partner Super User, and Partner Standard Admin can view the Analytics data for a specific customer in the Analytics portal (https://app.nyansa.com).
To view the Analytics data, perform the following steps.
Prerequisites
- Ensure that all the necessary system properties to enable Analytics are properly set in the SD-WAN Orchestrator. For more information, contact your Operator Super User.
- Ensure that you have access to the Analytics portal to view the Analytics data.
Procedure
- In the Enterprise portal, click Open New Orchestrator UI.
- Click Launch New Orchestrator UI in the pop-up window. The UI opens in a new tab displaying the monitoring options.
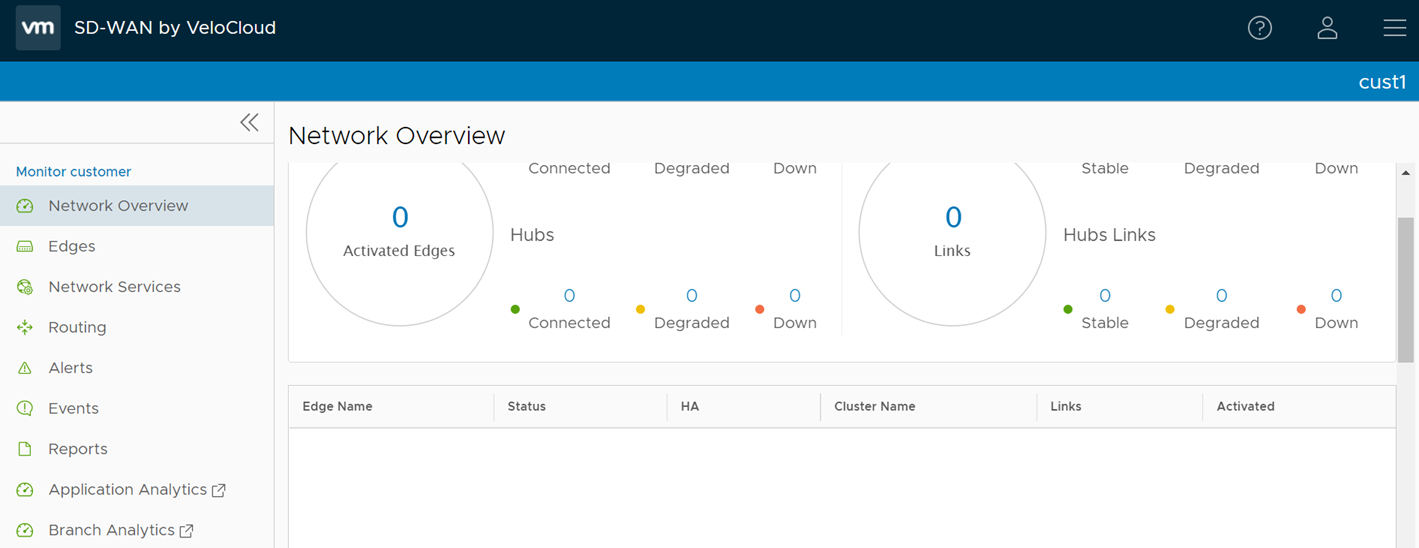
- In the Monitor Customers tab, click on the Customer name link for which you want to view the Analytics data.
- For a selected customer, to view Application Analytics data, click Application Analytics.
- To view Branch Analytics data, click Branch Analytics.
When the Analytics menu is clicked, the Analytics portal will be opened in a new browser tab, where you can view the Analytics data (Application and Branch) of all the Edges configured for a selected customer. Note that the Browser settings may prevent this action as popups. You need to allow it when browser shows notification.
What to do next
In the Analytics portal, you can configure additional data sources such as Wi-Fi and Wired metrics. For more information, see
VMware Edge Network Intelligence User Guide available at
https://docs.vmware.com/en/VMware-Edge-Network-Intelligence/index.html.
