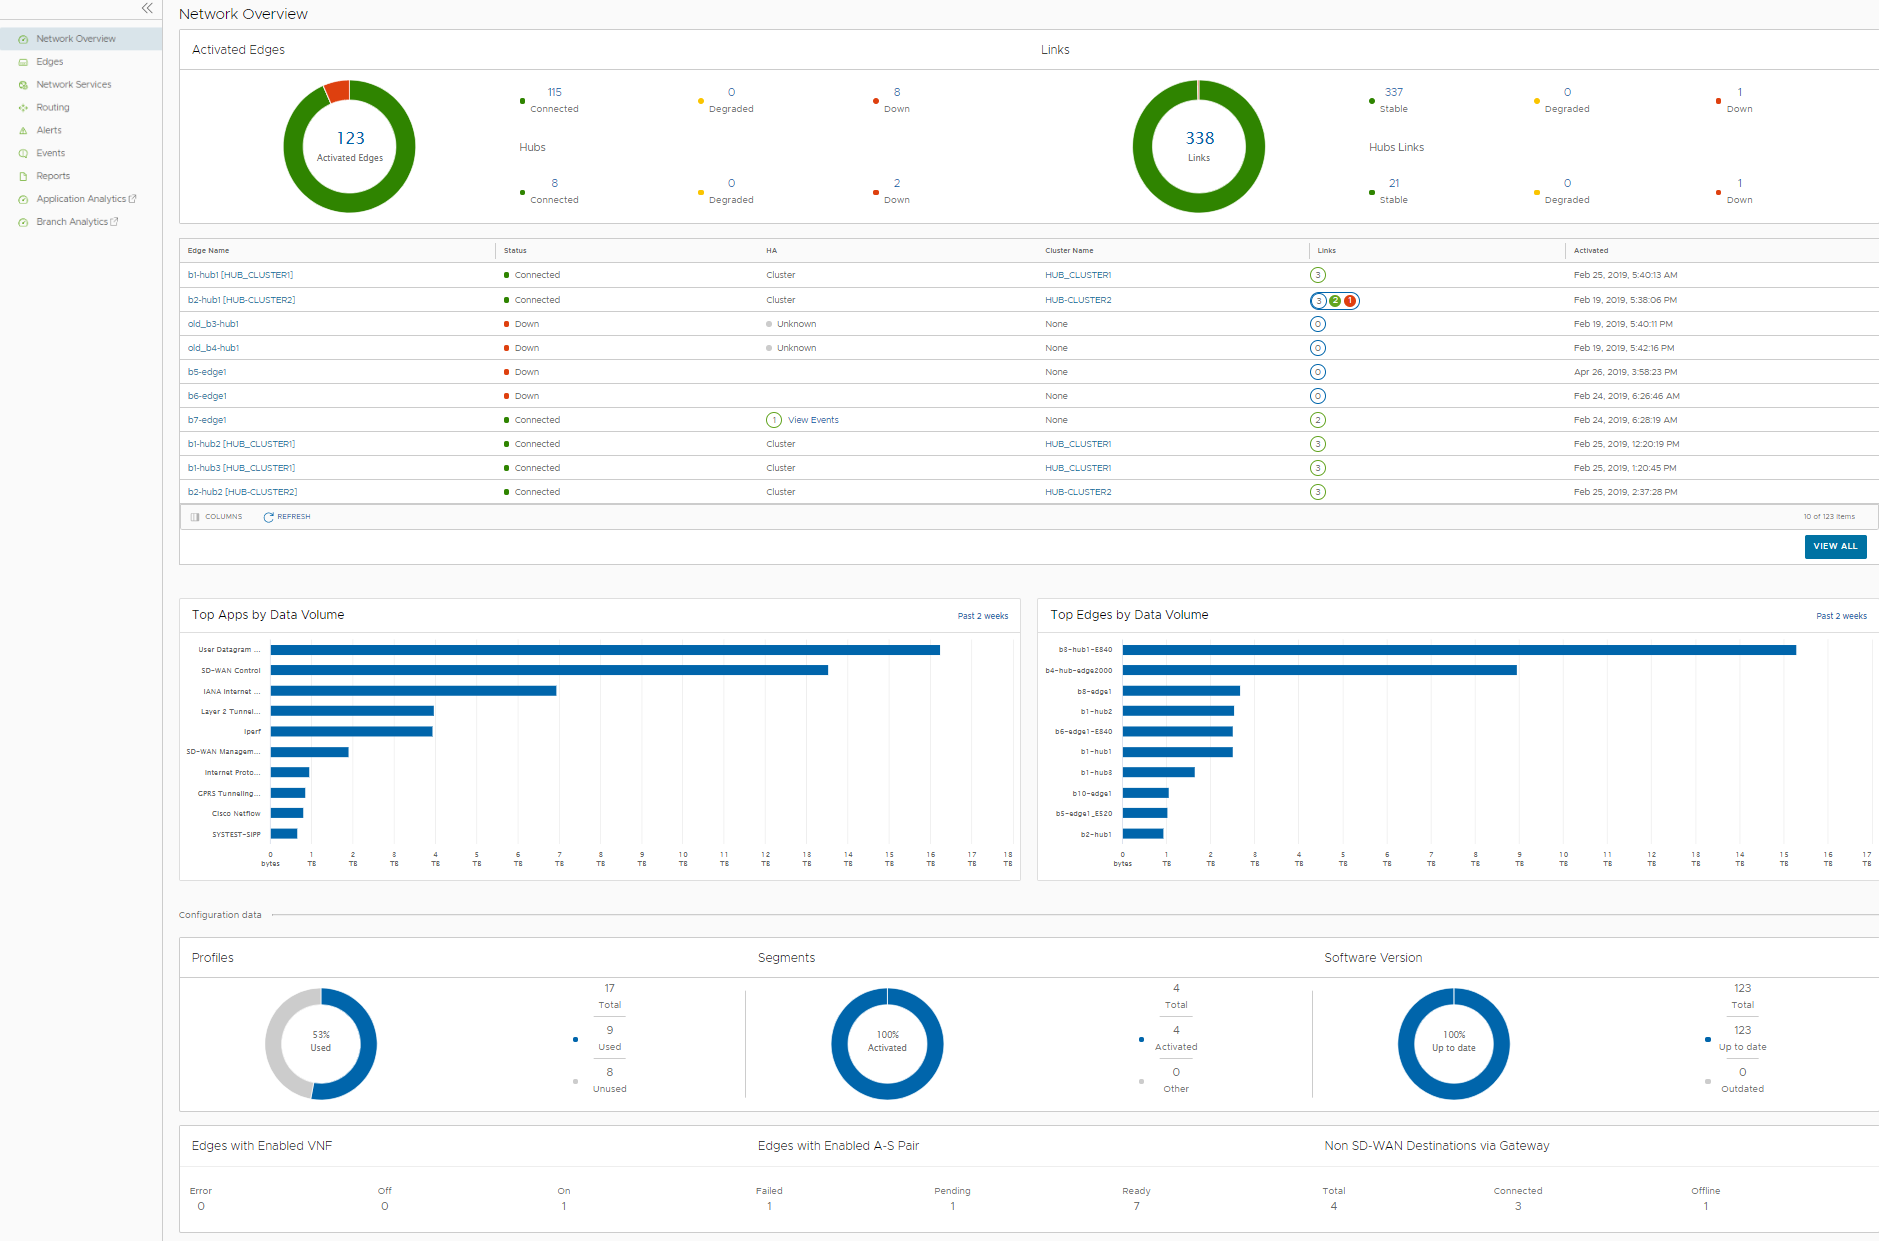
The Network Overview displays the overall summary of the network like activated Edges, links, top applications, and other configured data.
Procedure
- In the Enterprise portal, click the Open New Orchestrator UI option available at the top of the Window.
- Click Launch New Orchestrator UI in the pop-up window. The UI opens in a new tab.
- Click .
Results
The Network Overview page displays the summary of the network.

The window displays the following details:
| Option | Description |
|---|---|
| Activated Edges | Displays the number of Edges and Hubs that are connected, degraded, and down, along with a graphical representation. Click the link to a number and details of the corresponding Edges or Hubs are displayed in the bottom panel. In the bottom panel, click the link to the Edge or the cluster name to navigate to the corresponding tabs. |
| Links | Displays the number of links and hub links that are stable, degraded, and down, along with a graphical representation. Click the link to a number and details of the corresponding links or Hub links are displayed in the bottom panel. In the bottom panel, click the link to the Hub name to navigate to the corresponding tab. |
| Top Apps by Data Volume | Displays the top 10 applications sorted by volume of data. |
| Top Edges by Data Volume | Displays the top 10 Edges sorted by volume of data. |
| Profiles | Displays the details of used and unused profiles. |
| Segments | Displays the details of activated and other segments. |
| Software Version | Displays the details of software versions of the Edges, that are up to date and outdated. |
| Edges with Enabled VNF | Displays the number of Edges enabled with VNF, that are with status Error, Off, and On. |
| Edges with Enabled A-S Pair | Displays the number of Edges enabled as Active-Standby pair, that are with status Failed, Pending, and Ready. |
| Non SD-WAN Destinations via Gateway | Displays the number of non SD-WAN destinations that are connected and offline. |
Hover the mouse on the graphs to view more details.