


Operator events are triggered by the activities of Operators. These events help to determine the status of VMware System.
In the Operator portal, click Operator Events.
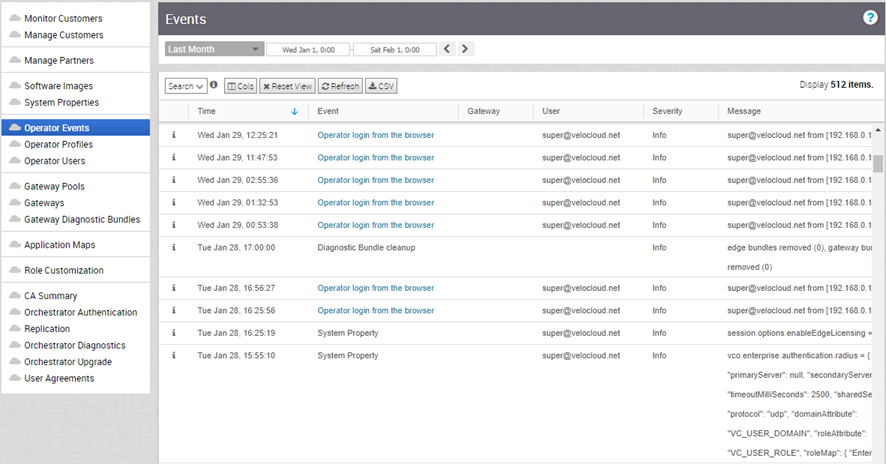
The page displays the recent Operator events. You can click the link to the events to view more details.
To view the older events, you can click the drop-down menu at the top of the page and choose the duration from the list. Alternatively, you can also enter the start and end dates at the top of the page to set a custom duration.
Once you choose or setup the duration, the page displays the events triggered during the selected period.
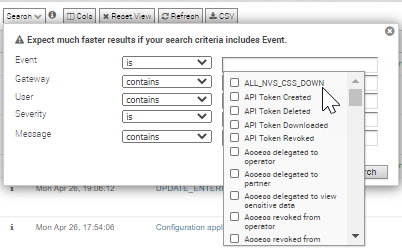
- Search – Enter a term to search for a specific detail. Click the drop-down arrow to filter the view by specific criteria. In the Filter, click the field next to Events to view the list of Operator Events available and to filter by specific Events.
- Cols – Click and select the columns to be shown or hidden in the view.
- Reset View – Click to reset the view to default settings.
- Refresh – Click to refresh the details displayed with the most current data.
- CSV – Click to export all data to a file in CSV format.
You can also view the Operator events using the new Orchestrator UI.
- In the Operator portal, click the Open New Orchestrator UI option available at the top of the Window.
- Click Launch New Orchestrator UI in the pop-up window. The UI opens in a new tab, displaying the Monitoring dashboard for the Customers.
- Click to view the events.
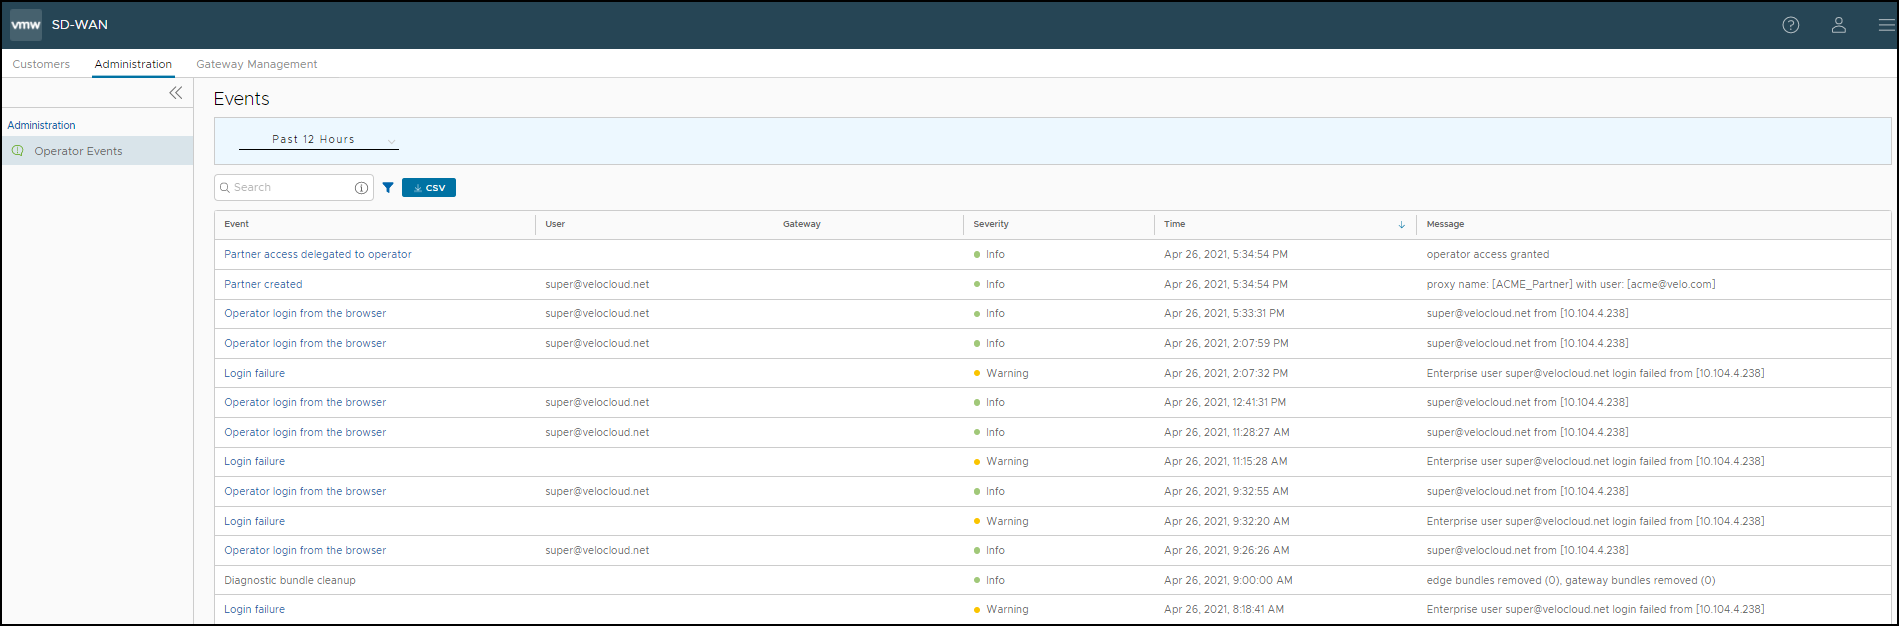
At the top of the page, you can choose a specific time period to view the details of events for the selected duration.
In the Search field, enter a term to search for specific details. Click the Filter Icon to filter the view by a specific criteria. In the Filter, choose Event and click the drop-down arrow next to the field to view the list of Operator Events available and to filter by specific Events.
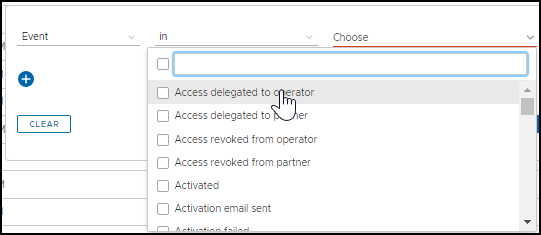
Click the CSV option to download a report of the events in CSV format.
