


The VMware Quality of Experience (QoE) tab shows the Quality Score for different applications. The Quality score rates an application's quality of experience that a network can deliver for a period of time. The QoE is calculated based on the best score comparing all the Static tunnels (Edge to Gateways and Edge to Hubs) and then displays the best performing tunnel.
Click the tab to view the following details.
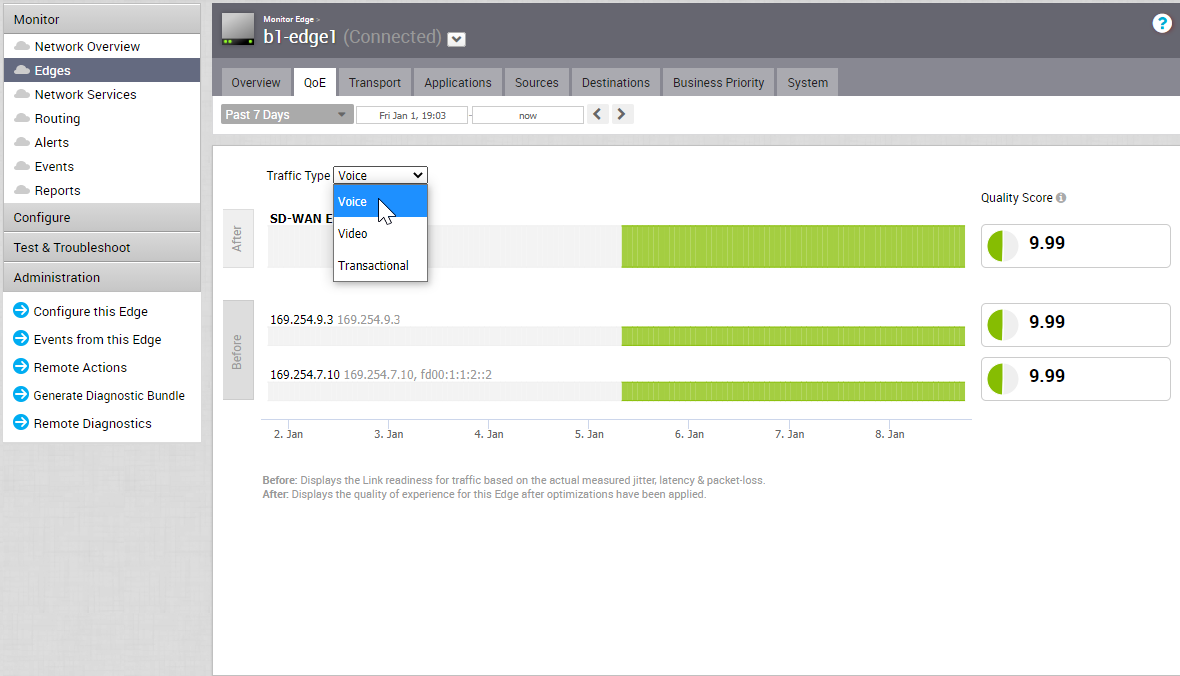
Traffic Type
There are three different traffic types that you can monitor (Voice, Video, and Transactional) in the QoE tab. You can hover over a WAN network link, or the aggregate link to display a summary of Latency, Jitter, and Packet Loss.
Quality Score
The Quality Score rates an application's quality of experience that a network can deliver for a given time frame. Some examples of applications are video, voice, and transactional. QoE rating options are shown in the table below.
| Rating Color | Rating Option | Definition |
|---|---|---|
| Green | Good | All metrics are better than the objective thresholds. Application SLA met/exceeded. |
| Yellow | Fair | Some or all metrics are between the objective and maximum values. Application SLA is partially met. |
| Red | Poor | Some or all metrics have reached or exceeded the maximum value. Application SLA is not met. |
QoE Example
The following images show examples of QoE with before and after voice traffic scenario problems and how VMware solved them. The red numbers in the following images represent the scenario numbers in the table.
QoE Example Table
| Scenario | Issue | VMware Solution |
|---|---|---|
| 1 | MPLS is down | Link steering |
| 2 | Packet loss | Forward error correction |
| 3 | MPLS is down; Jitter on Comcast | Link steering and jitter buffering |
Scenario 1 and 2: Link Steering and Forward Error Correction Solution Example

Scenario 3: Link Steering and Jitter Buffering Solution Example

