


The Overview tab of an Edge in the monitoring dashboard displays the details of WAN links along with bandwidth consumption and network usage.
Procedure
- In the Enterprise portal, click .
- Click the link to an Edge and the Overview tab is displayed by default.
Results
The Overview tab displays the details of links with status and the bandwidth consumption.
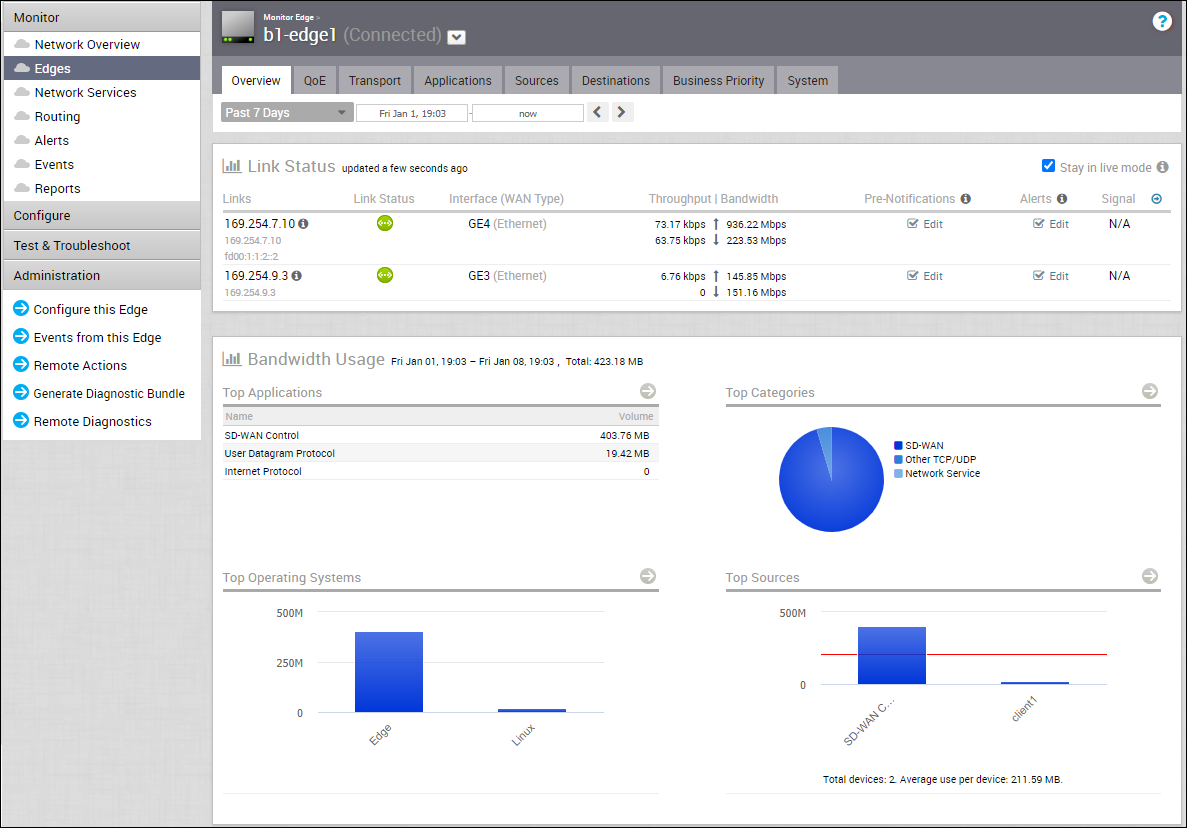
You can choose to view the Edge information live by selecting the Stay in live mode checkbox. When this mode is enabled, live monitoring of the Edge happens and the data in the page is updated whenever there is a change. The live mode is automatically moved to offline mode after a period of time to reduce the network load.
The Links Status section displays the following details:
| Option | Description |
|---|---|
| Links | The Interface and WAN links of the selected Edge. |
| Link Status | Connectivity status of the Link to the Gateway. |
| Interface (WAN Type) | The Interface connected to the Link. |
| Throughput | Total bytes in a given direction divided by the total time. The total time is the periodicity of statistics uploaded from the Edge. By default, the periodicity in the Orchestrator is 5 minutes. |
| Bandwidth | The maximum rate of data transfer across a given path. Displays both the upstream and downstream bandwidth details. |
| Pre-Notifications | Allows to activate or deactivate the alerts sent to the Operator. Click Edit to modify the notification settings. |
| Alerts | Allows to activate or deactivate the alerts sent to the Enterprise Customer. Click Edit to modify the notification settings. |
| Signal | Information on signal strength. |
| Latency | Time taken for a packet to get across the network, from source to destination. Displays both the upstream and downstream Latency details. |
| Jitter | Variation in the delay of received packets caused by network congestion or route changes. Displays both the upstream and downstream Jitter details. |
| Packet loss | Packet loss happens when one or more packets fail to reach the intended destination. A lost packet is calculated when a path sequence number is missed and does not arrive within the re-sequencing window. A “very late” packet is counted as a lost packet. |
The Bandwidth Usage section displays graphical representation of bandwidth and network usage of the following: Applications, Categories, Operating Systems, Sources, and Destinations of the Edges. Click View Details in each panel to navigate to the corresponding tab and view more details.
Hover the mouse on the graphs to view more details.
