


You can view the detailed network usage by the system for a specific Edge.
To view the details of system information:
Procedure
- In the Enterprise portal, click .
- Click the link to an Edge and click the System tab.
Results
The System tab displays the details of network usage by the system for the selected Edge.
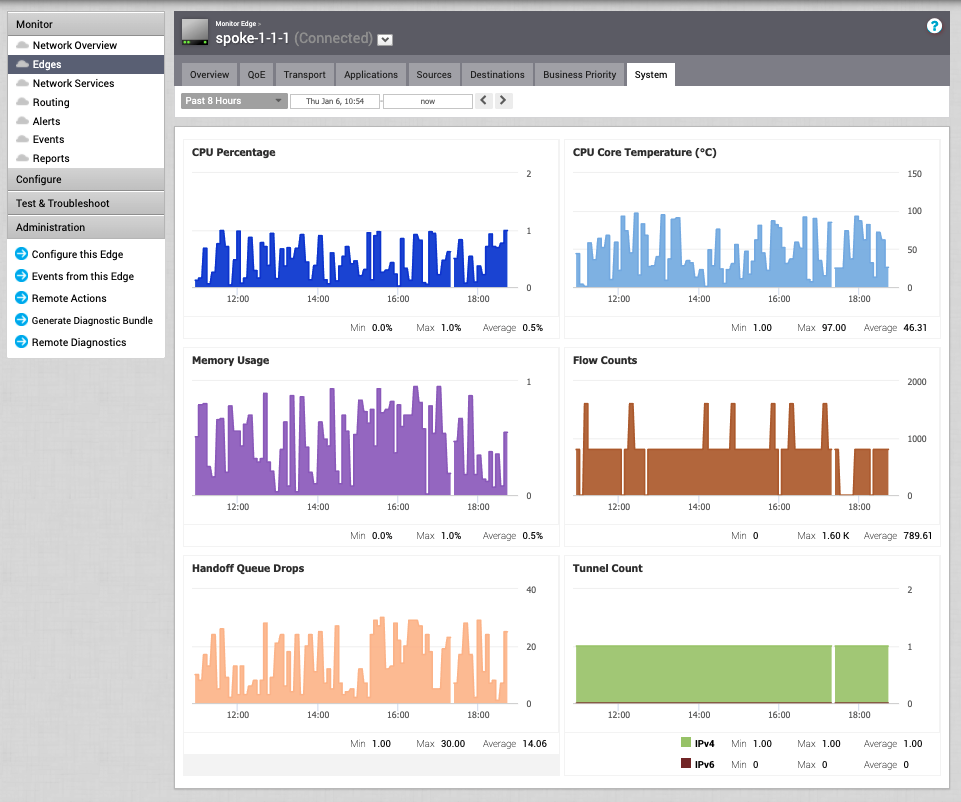
The page displays graphical representation of usage details of the following over the period of selected time duration, along with the minimum, maximum, and average values.
- CPU Percentage – Percentage of usage of CPU.
- CPU Core Temperature – The core temperature of the Edge CPU.
- Memory Usage– Percentage of usage of memory.
- Flow Counts – Count of traffic flow.
- Handoff Queue Drops – Count of packets dropped due to oversubscription of the Edge resources.
- Tunnel Count – Count of tunnel sessions.
Hover the mouse on the graphs to view more details.
