You can monitor the status and network usage data of SD-WAN Gateways available in the Operator and the Partner portal.
To monitor the SD-WAN Gateways:
Procedure
- In the Operator portal, click the Open New Orchestrator UI option available at the top of the Window.
- Click Launch New Orchestrator UI in the pop-up window. The UI opens in a new tab.
- Click .
Results
The Gateways page displays the list of available SD-WAN Gateways.

Click Map Distribution to expand and view the locations of the SD-WAN Gateways in the Map. By default, this view is collapsed.
You can also click the arrows prior to each SD-WAN Gateways name to view more details.
The page displays the following details:
- Name – Name of the SD-WAN Gateways.
- Status – Current status of the SD-WAN Gateways. The status may be one of the following: Connected, Degraded, Never Activated, Not in Use, Offline, Out of Service, or Quiesced.
- CPU – Percentage of CPU utilization by the SD-WAN Gateways.
- Memory – Percentage of memory utilization by the SD-WAN Gateways.
- Edges – Number of SD-WAN Edges connected to the SD-WAN Gateways.
- Service State – Service state of the SD-WAN Gateways. The state may be one of the following: Historical, In Service, Out of Service, Pending Service, or Quiesced.
- IP Address – The IP Address of the SD-WAN Gateways.
- Location – Location of the SD-WAN Gateways.
In the Search field, enter a term to search for specific details. Click the Filter icon to filter the view by a specific criterion.
Click the CSV option to download a report of the SD-WAN Gateways in the CSV format.
Click the link to a SD-WAN Gateway to view the details of the selected SD-WAN Gateway.

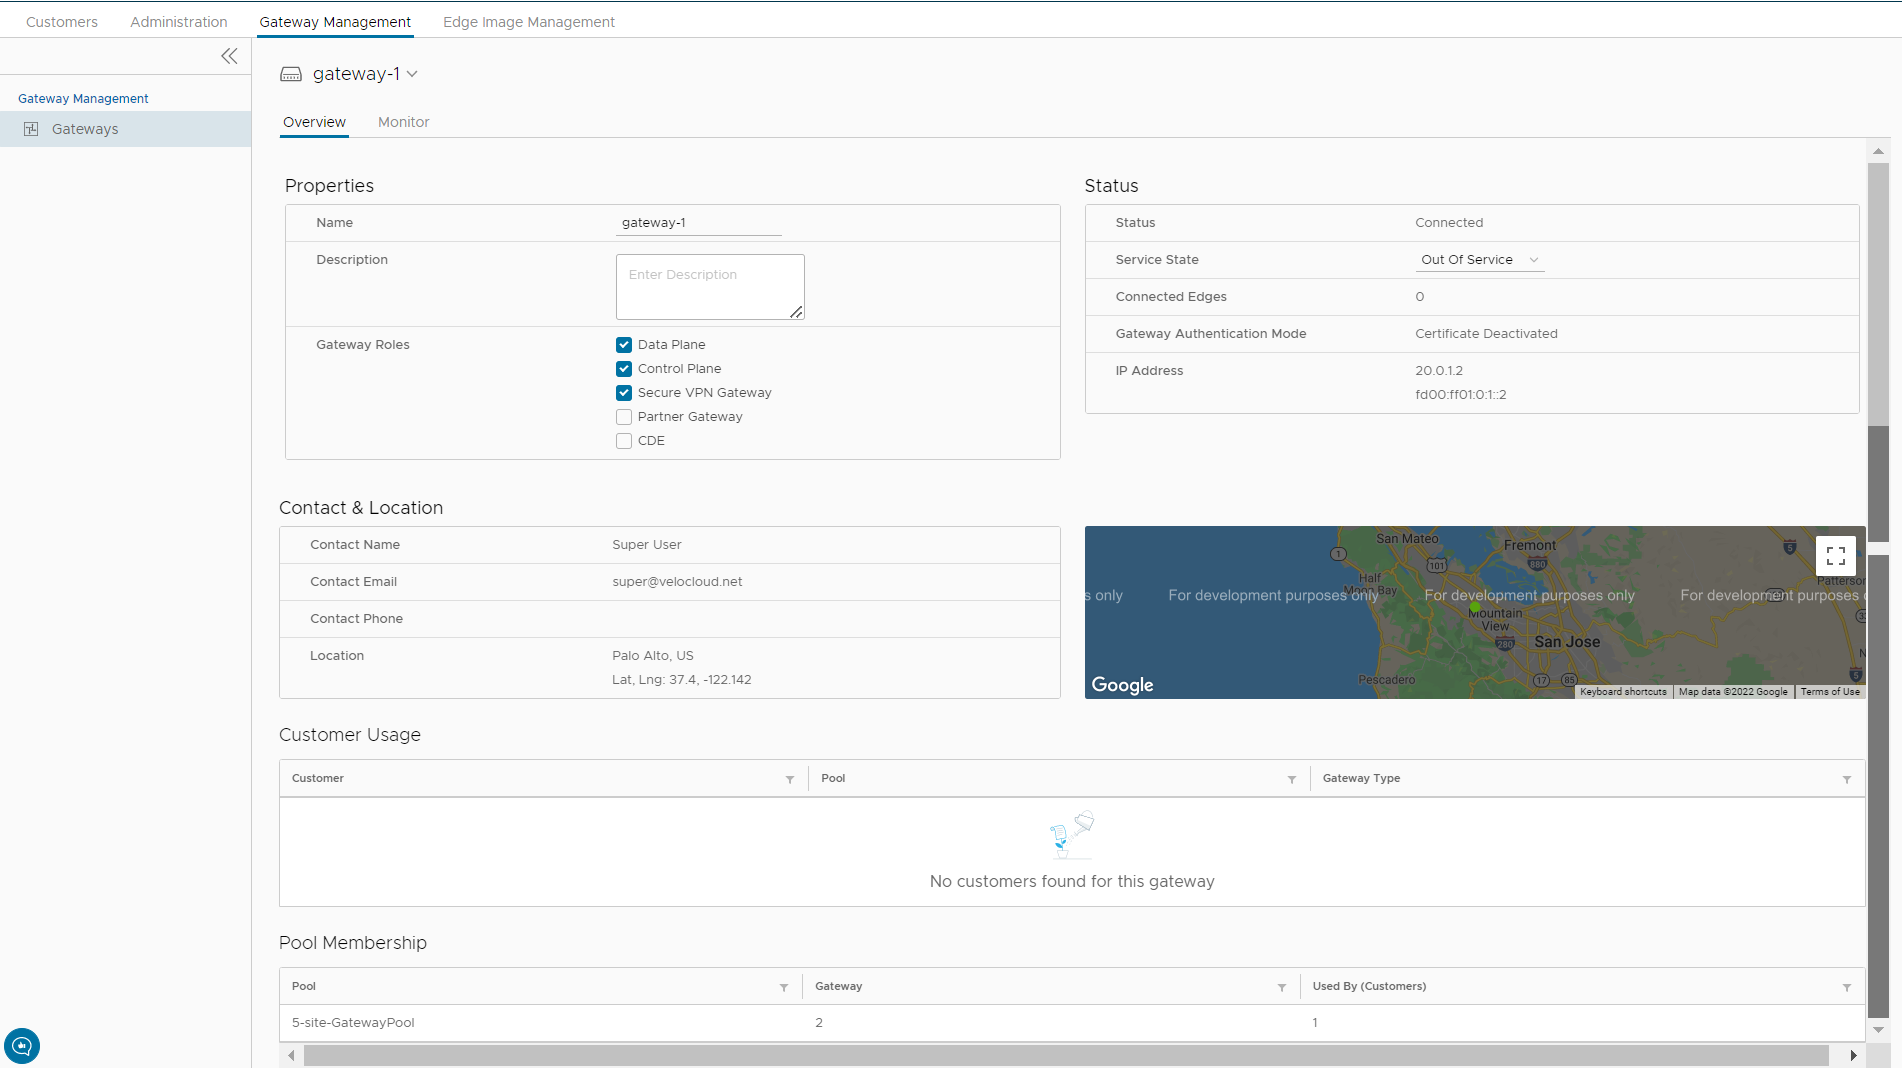
The Overview tab displays the properties, status, location, customer usage, and SD-WAN Gateway Pool of the selected SD-WAN Gateway.
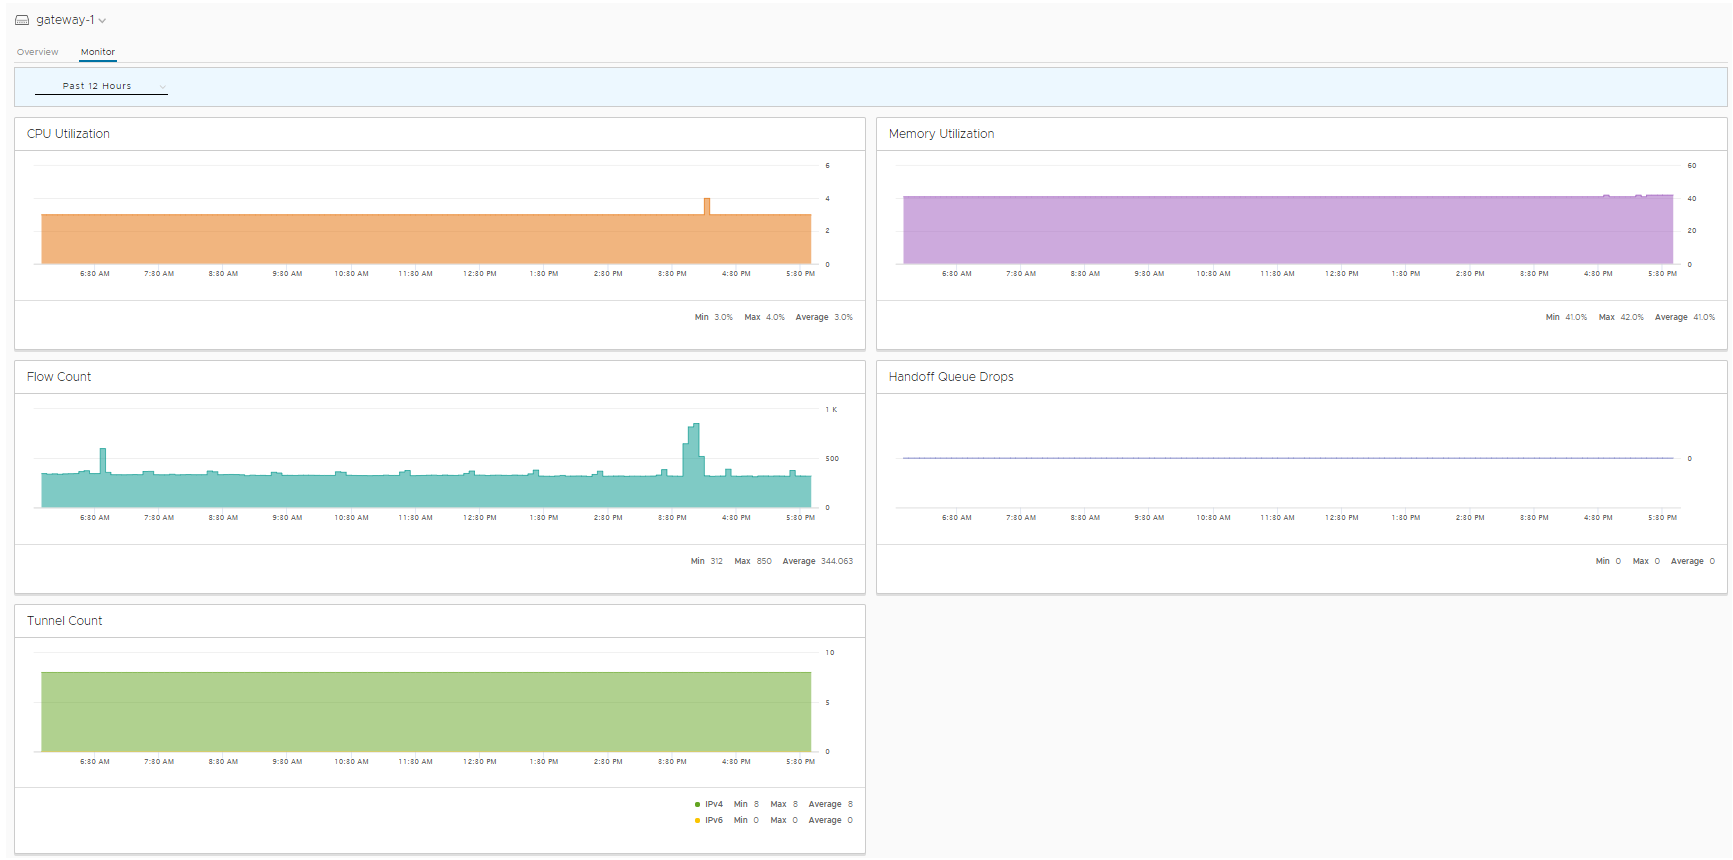
Click the Monitor tab to view the usage details of the selected SD-WAN Gateways.

For more information on the data displayed, see Monitor Gateways.