


The Monitoring dashboard in the Enterprise portal allows for report generation with overall network summary along with information on SD-WAN traffic and transport distribution. Reports allow the analysis of your network.
In the Enterprise portal, click .
To create a new report:
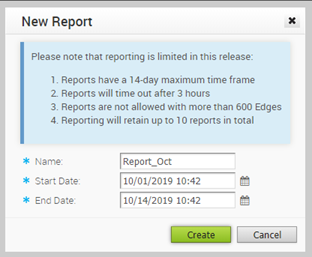
- In the Reports window, click New Report.
- In the New Report window, enter a descriptive name for the report and choose the start and end dates.
- Click Create.
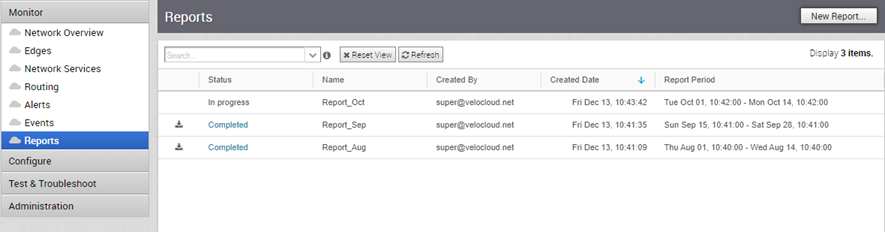
The Status of the report generation is displayed in the window. Once completed, you can download the report by clicking the Completed link.
The Download Report window provides the following options:
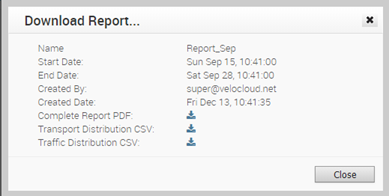
You can download the report as a PDF that provides an overall summary of the traffic and transport distribution, represented as a pie chart. This report also provides the list of top 10 applications by the traffic and transport type.
You can choose to download the reports by transport or traffic distribution, as a CSV file.
- The transport distribution report displays the details of time, transport type, applications, name and description of the edges, and the bytes sent and received.
- The traffic distribution report displays the details of time, flow path, applications, name and description of the edges, and the bytes sent and received.
