


You can monitor the status and network usage data of SD-WAN Gateways available in the Operator portal.
To monitor the SD-WAN Gateways:
Procedure
- The Gateways page displays the list of available Gateways.
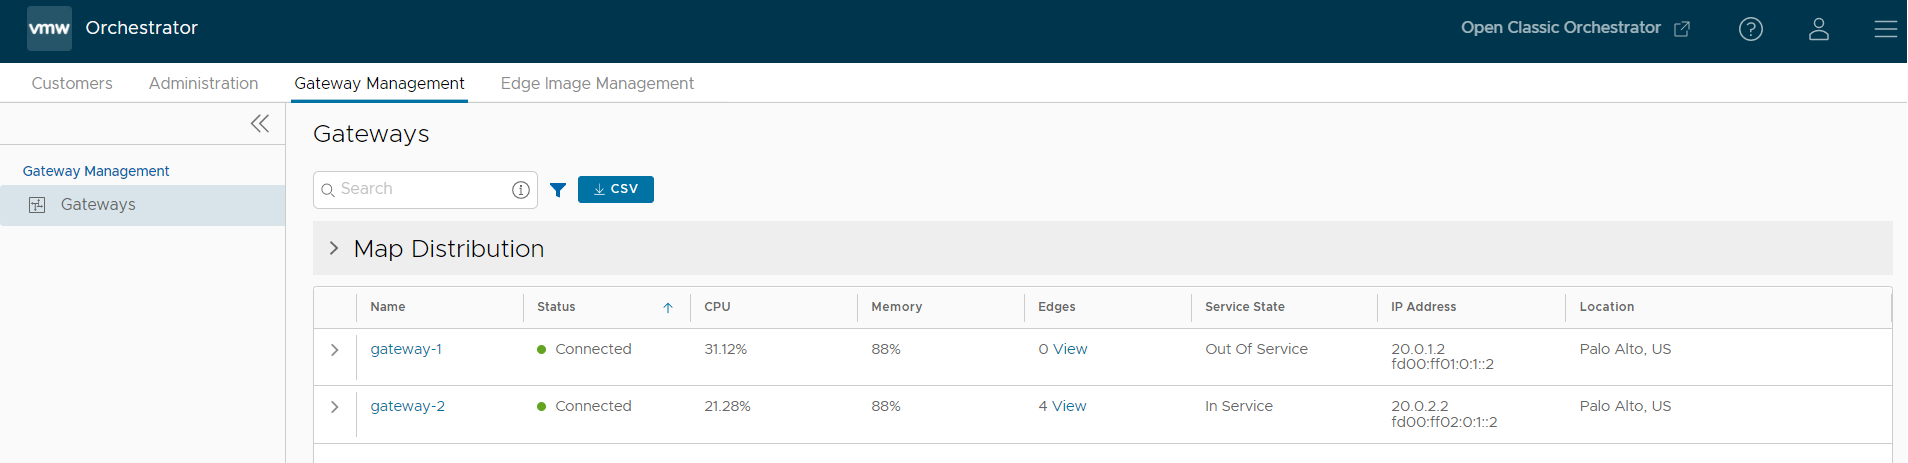
- Click the link to a SD-WAN Gateway to view the details of the selected SD-WAN Gateway.
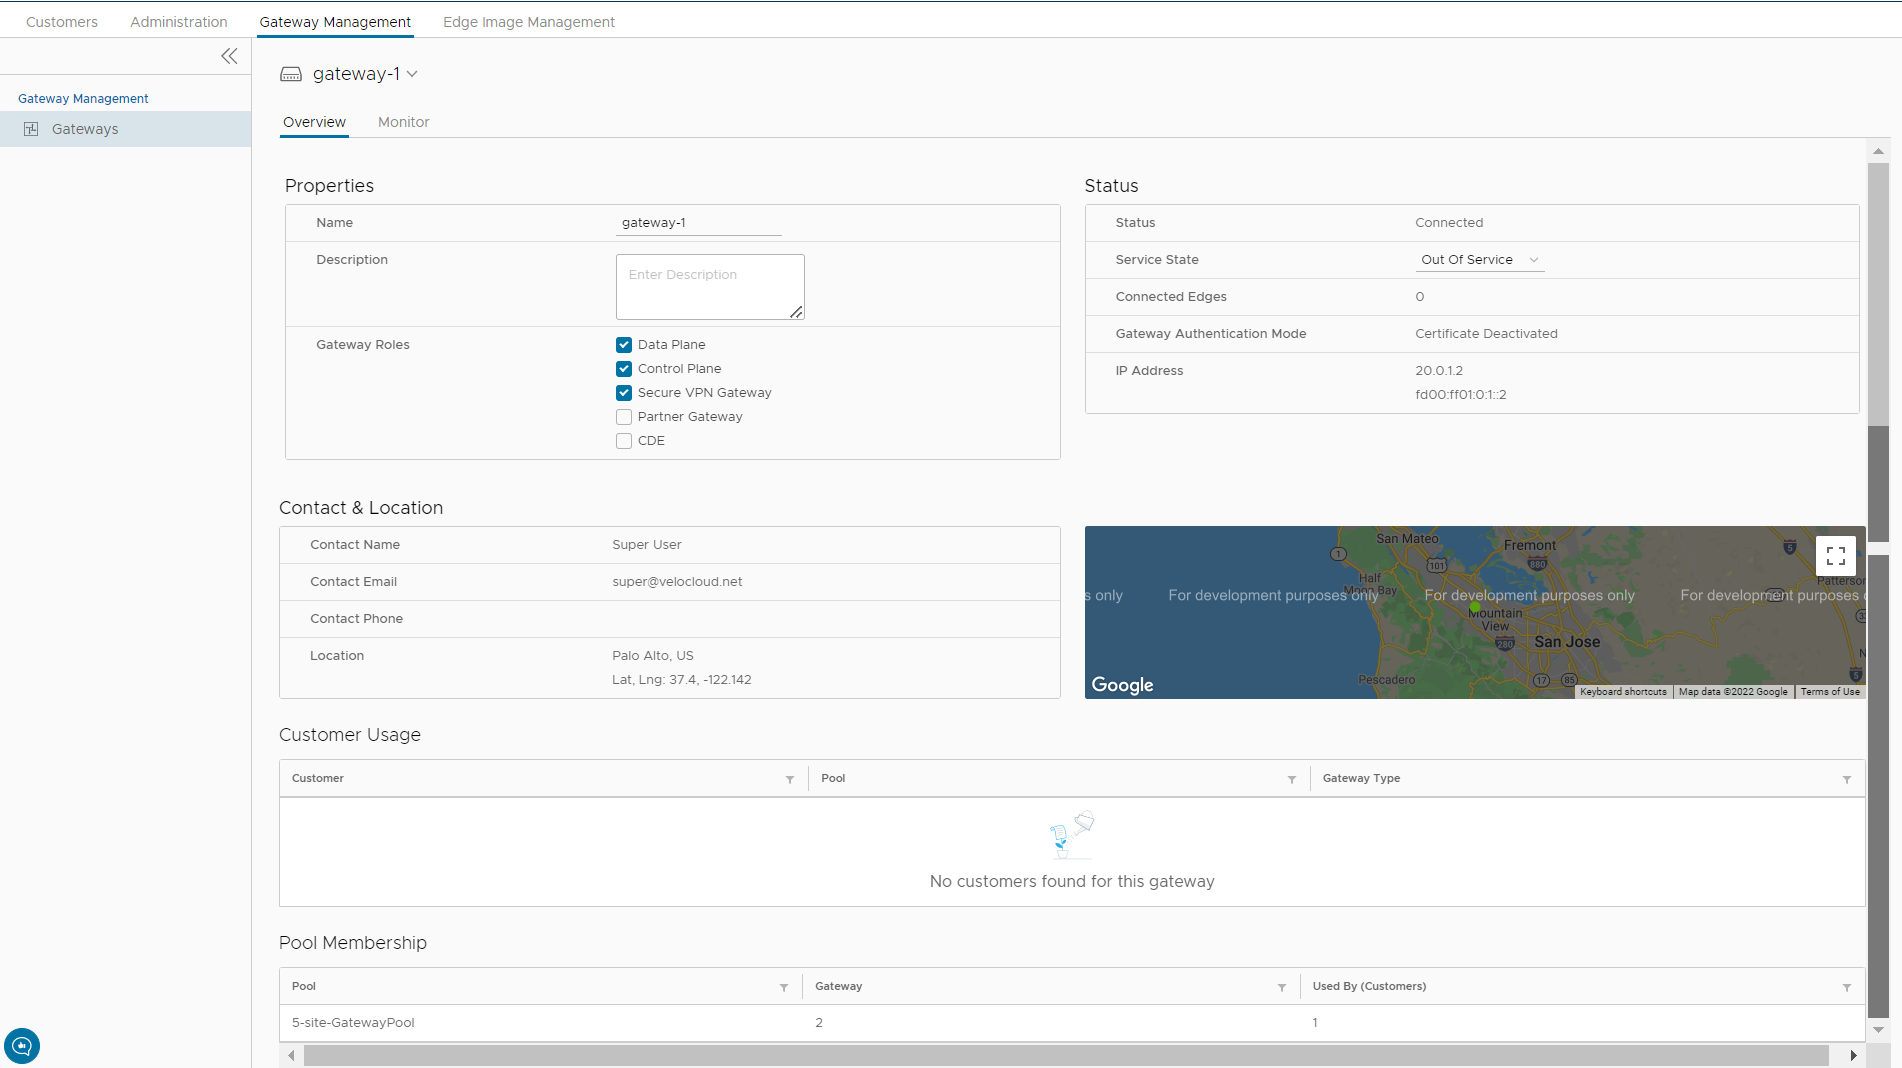
The Overview tab displays the properties, status, location, customer usage, and SD-WAN Gateway Pool of the selected SD-WAN Gateway.
Note: In the Overview tab, you can modify the Name and Description of the selected Gateway, and choose a different Service State. To configure the other options, navigate to the Gateways page in the Operator portal. - Click the Monitor tab to view the usage details of the selected SD-WAN Gateways.
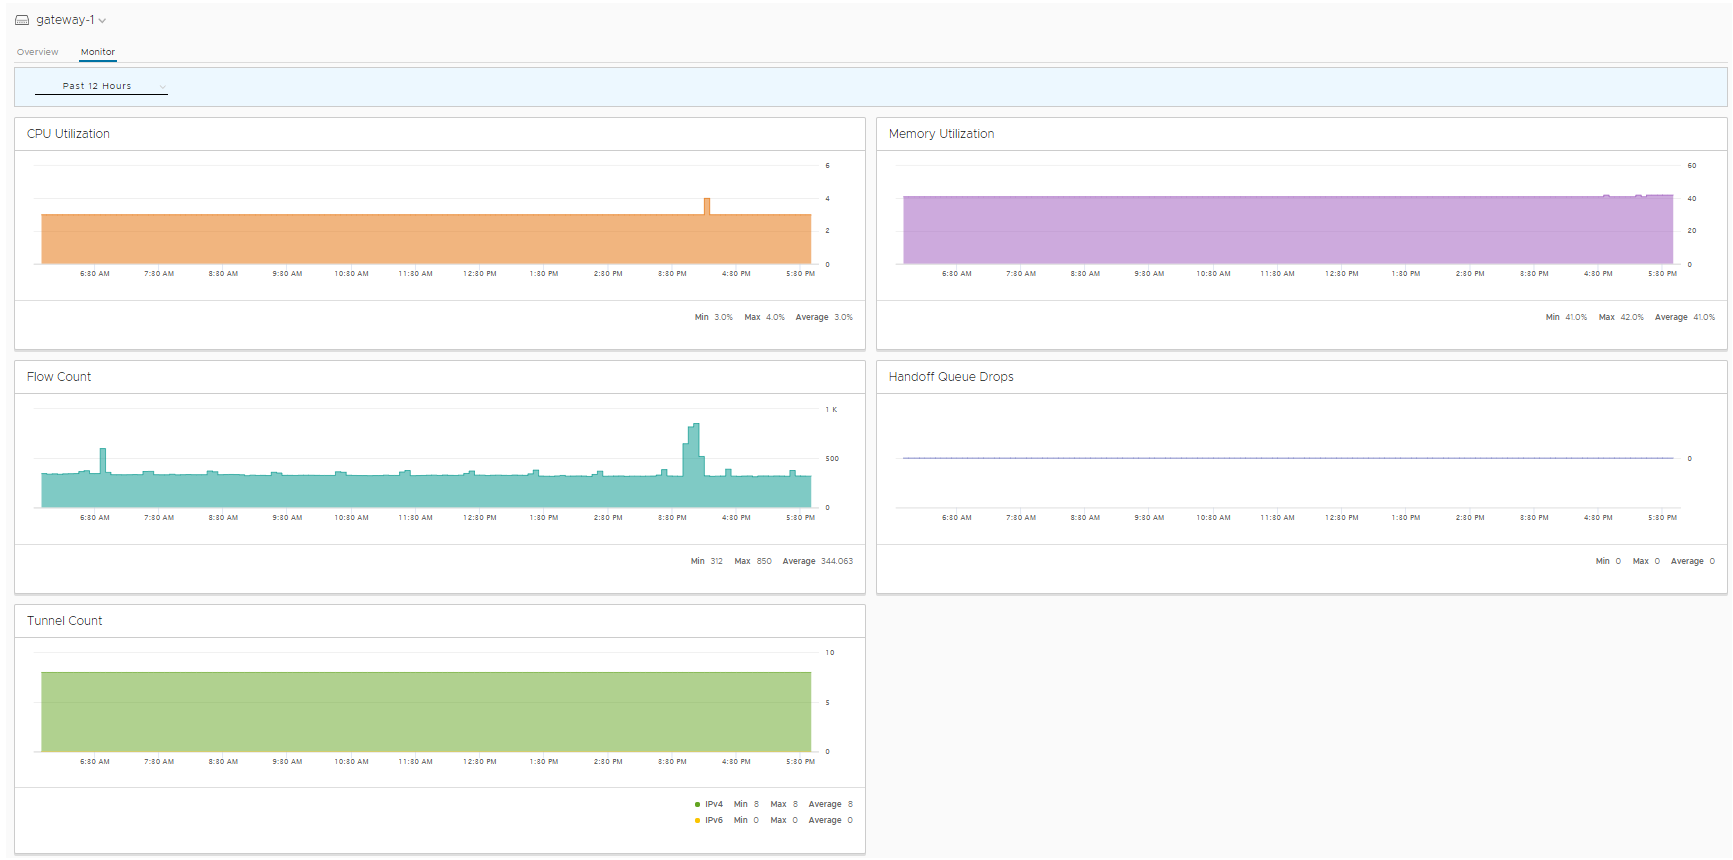
At the top of the page, you can choose a specific time period to view the details of the Gateway for the selected duration.
The page displays graphical representation of usage details of the following parameters for the period of selected time duration, along with the minimum, maximum, and average values.
- CPU Percentage – Percentage of usage of CPU.
- Memory Usage – Percentage of usage of memory.
- Flow Counts – Count of traffic flow.
- Handoff Queue Drops – Total number of packets dropped from a queue since the Gateway was last rebooted. Occasional drops are expected, usually caused by a large burst of traffic. However, a consistent increase in handoff queue drops usually indicates a Gateway capacity issue.
- Tunnel Count – Count of tunnel sessions for both the IPv4 and IPv6 addresses.
Hover the mouse on the graphs to view more details.
