


Path is a tunnel between two endpoints. Path visibility is a report on utilization and quality of the paths between an Edge and its VMware SD-WAN peers. SASE Orchestrator allows an Enterprise user to monitor the Path visibility using the monitoring dashboard.
For a selected Edge, you can monitor the Path information for the VMware SD-WAN peers with traffic flow observed for a specific period.
Procedure
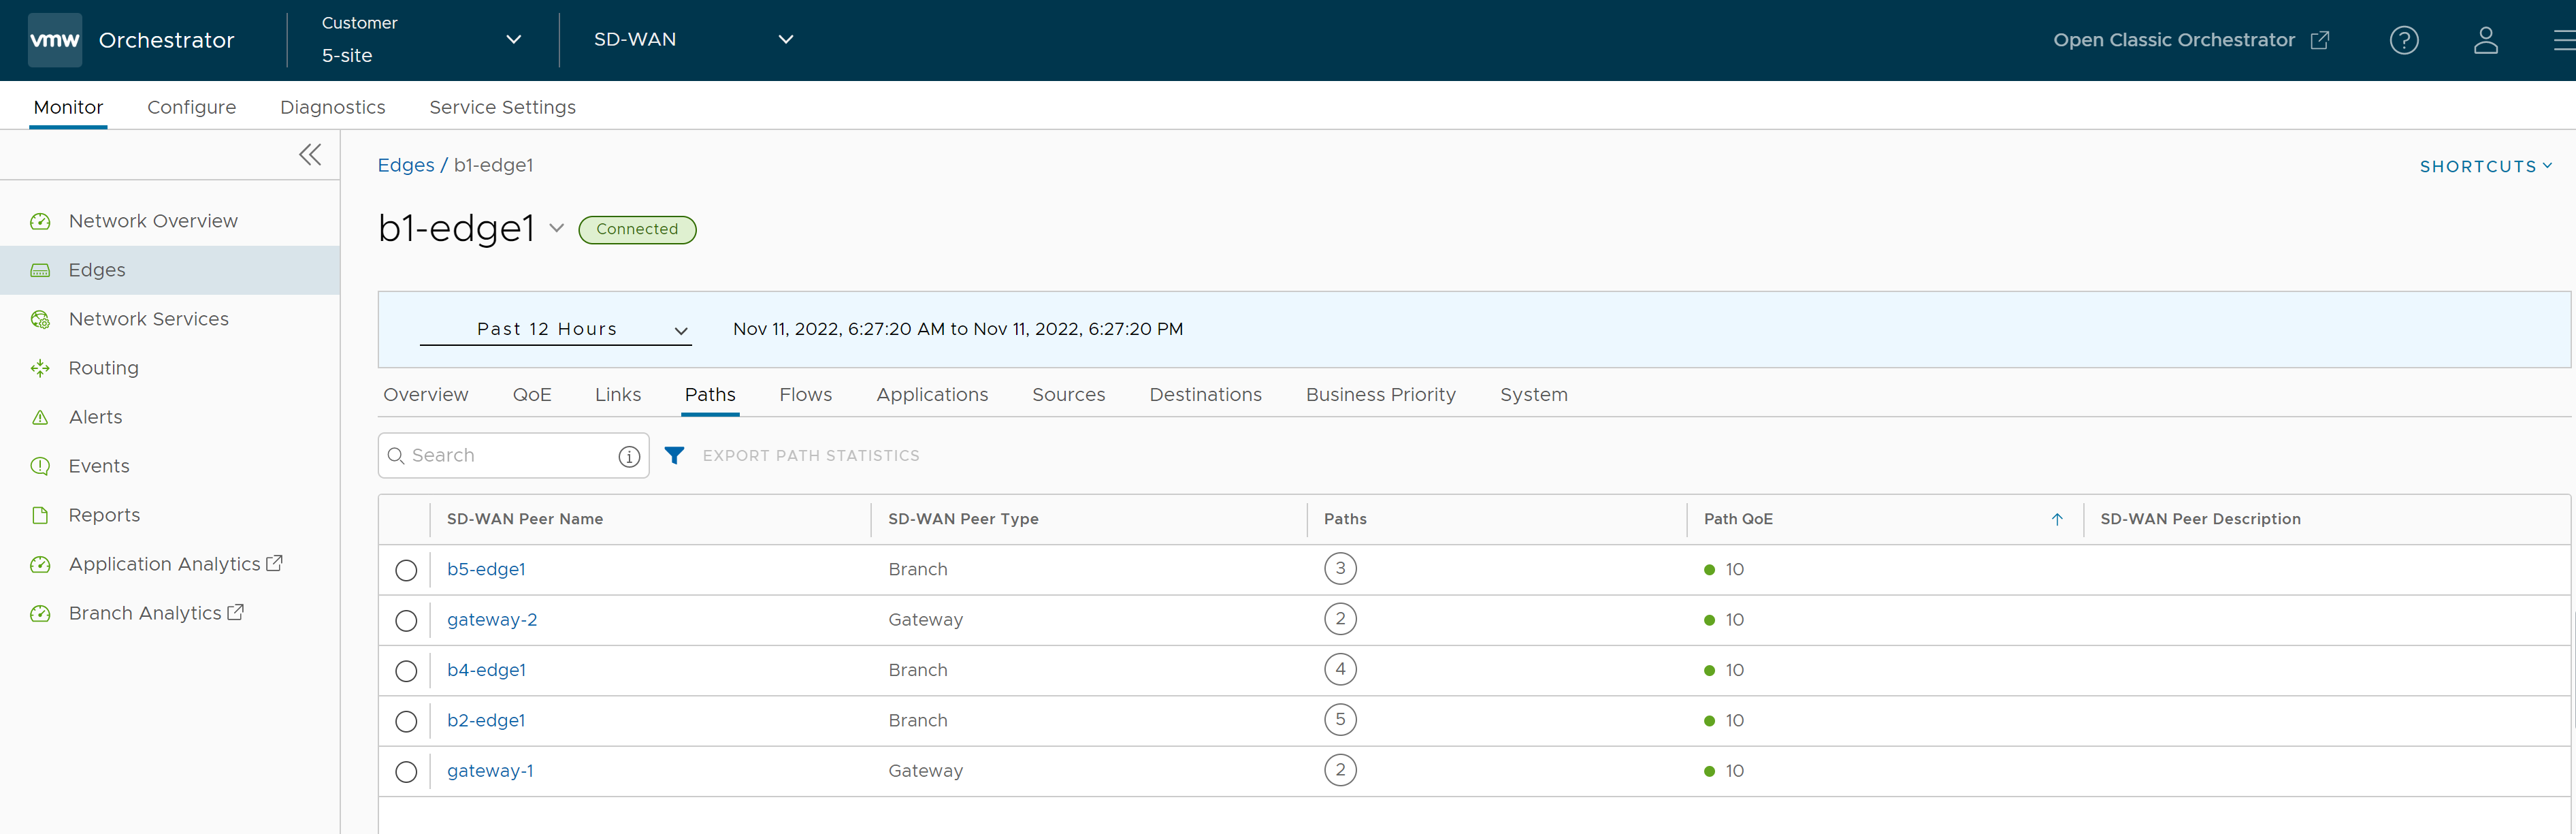
- In the SD-WAN service of the Enterprise portal,, click to view the Edges associated with the Enterprise.
- Click the link to an Edge, and then click the Paths tab.
Results
At the top of the page, you can choose a specific time period to view the details of the priorities for the selected duration.
To get a report of a VMware SD-WAN peer in CSV format, select the peer and click Export Path Statistics.
Click the link to a VMware SD-WAN peer to view the corresponding Path details as follows:
- All the VMware SD-WAN peers that have traffic observed during the selected time period.
- The status of the paths available for a selected peer.
- Overall quality score of the paths for a selected peer for voice, video, and transactional traffic.
- Time series data for each path by metrics like: Throughput, Latency, Packet loss, Jitter, and so on. For more information on the parameters, see Monitor Edges.
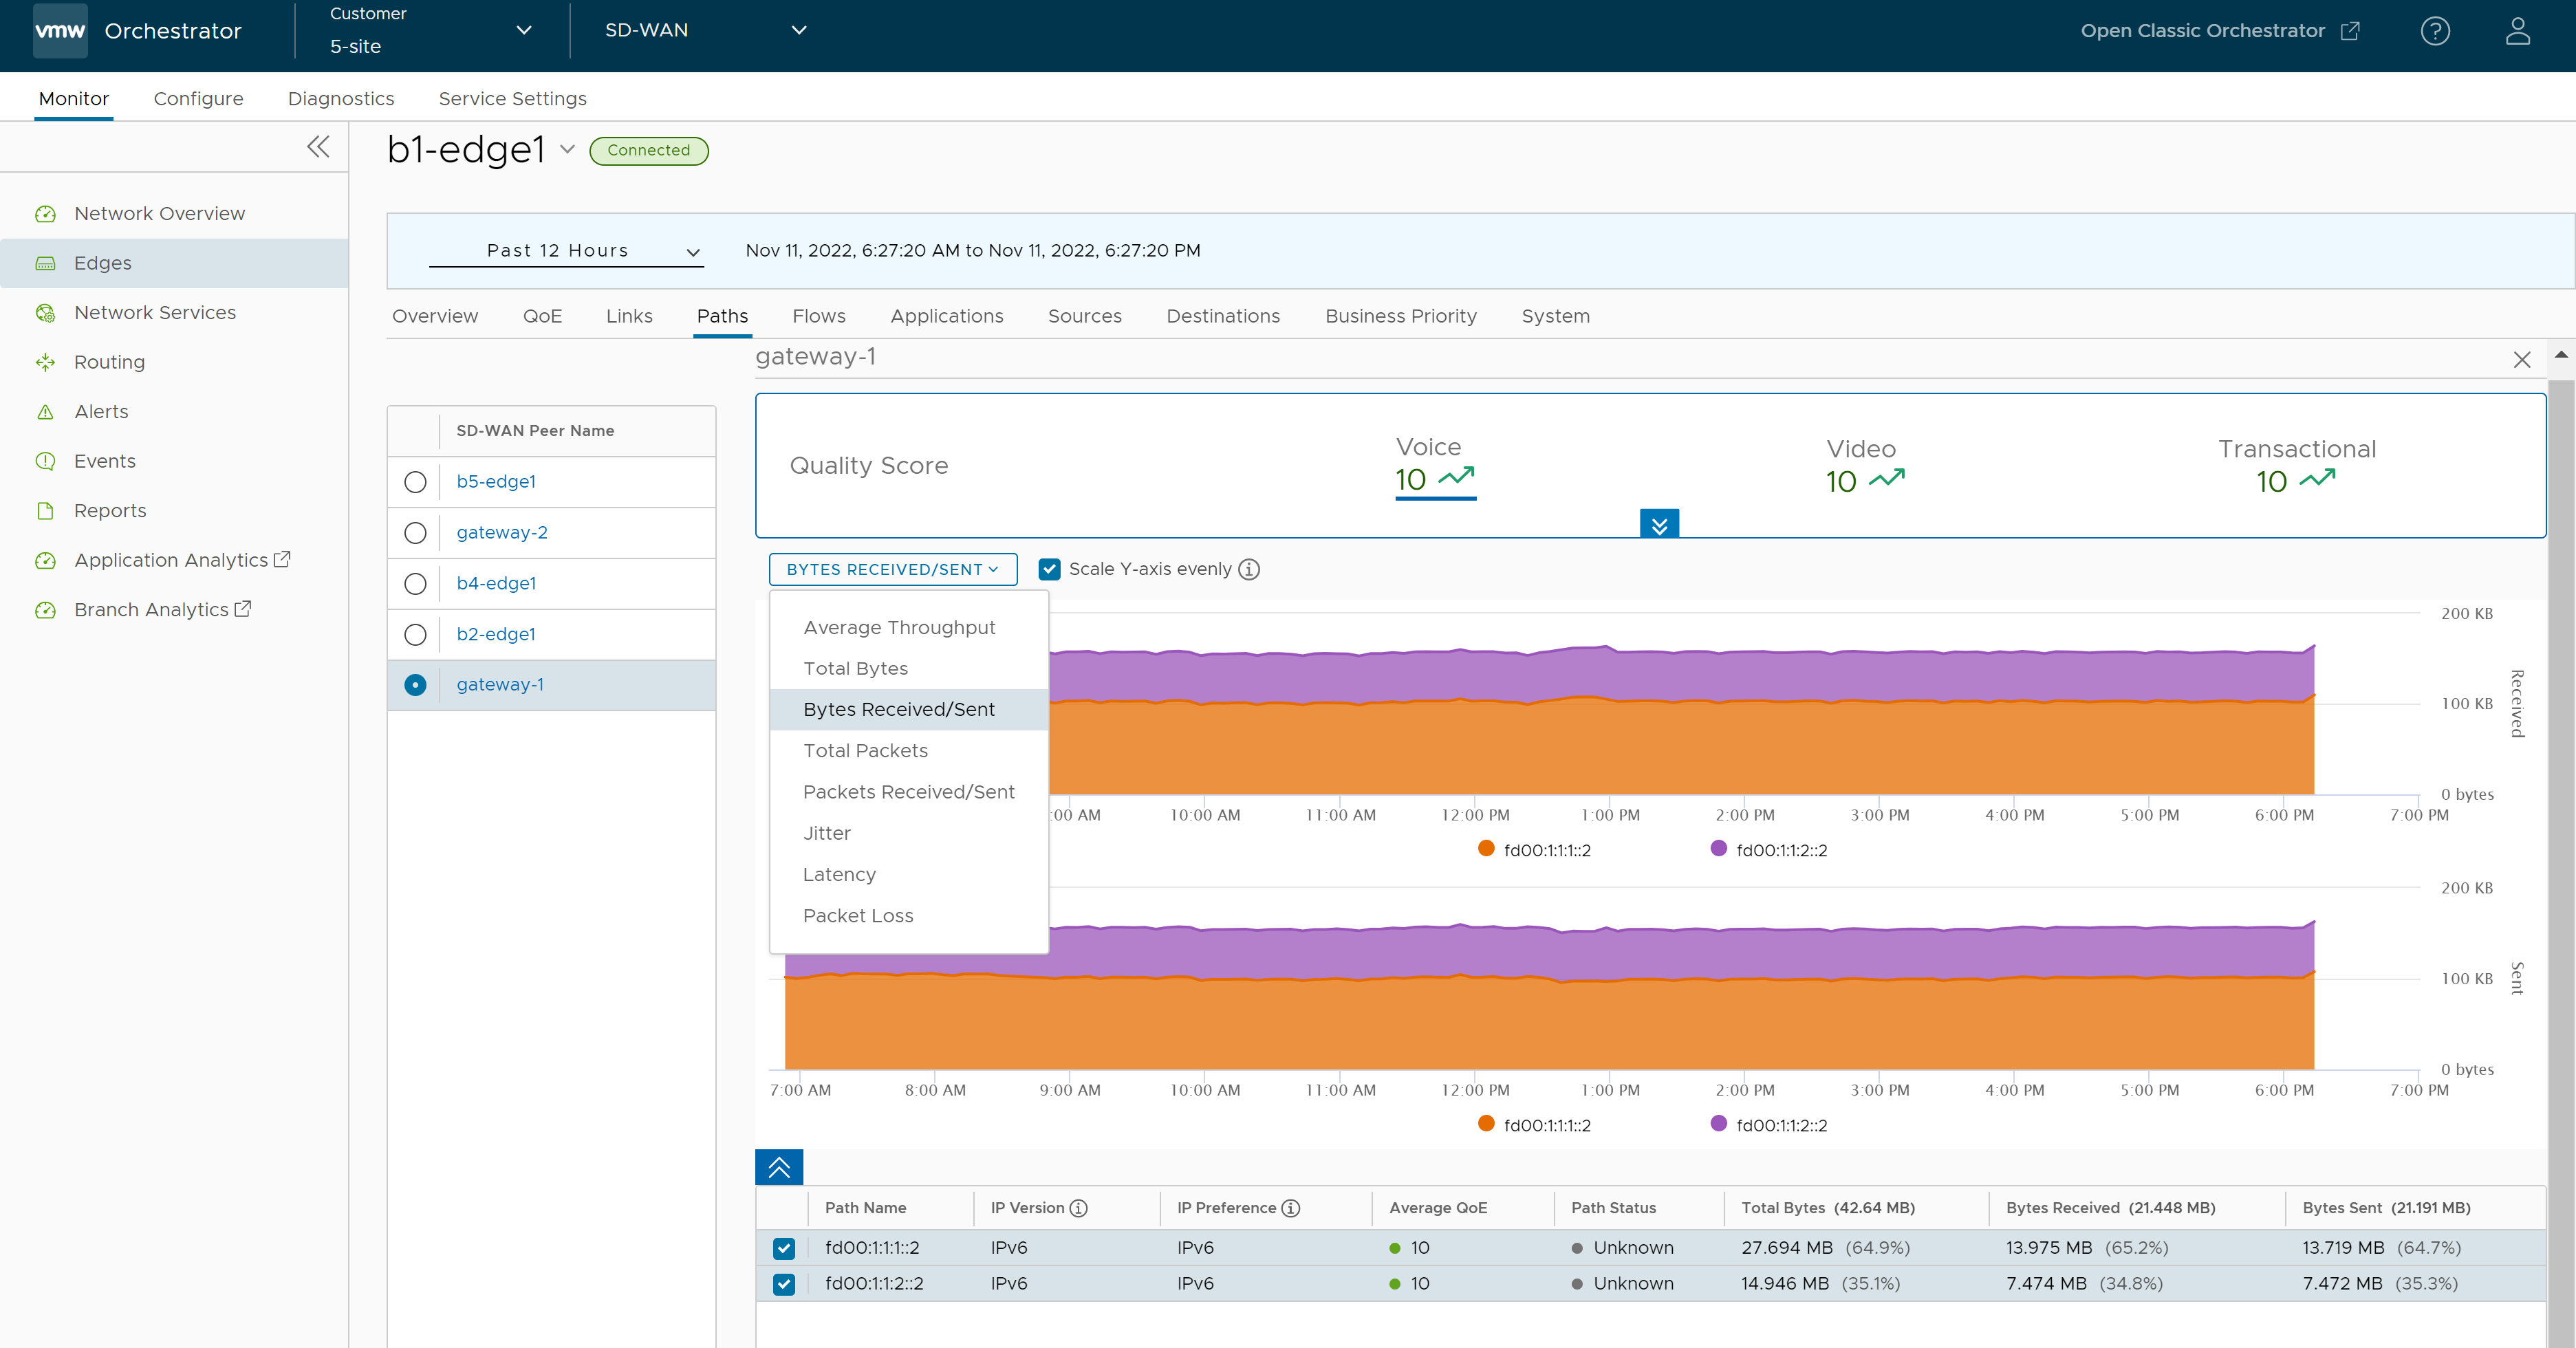
The metrics time-series data is displayed in a graphical format. You can select and view the details of a maximum of 4 paths at a time.
By default, the Scale Y-axis evenly check box is selected. This option synchronizes the Y-axis between the charts. If required, you can turn off this option.
Hover the mouse on the graphs to view more details.
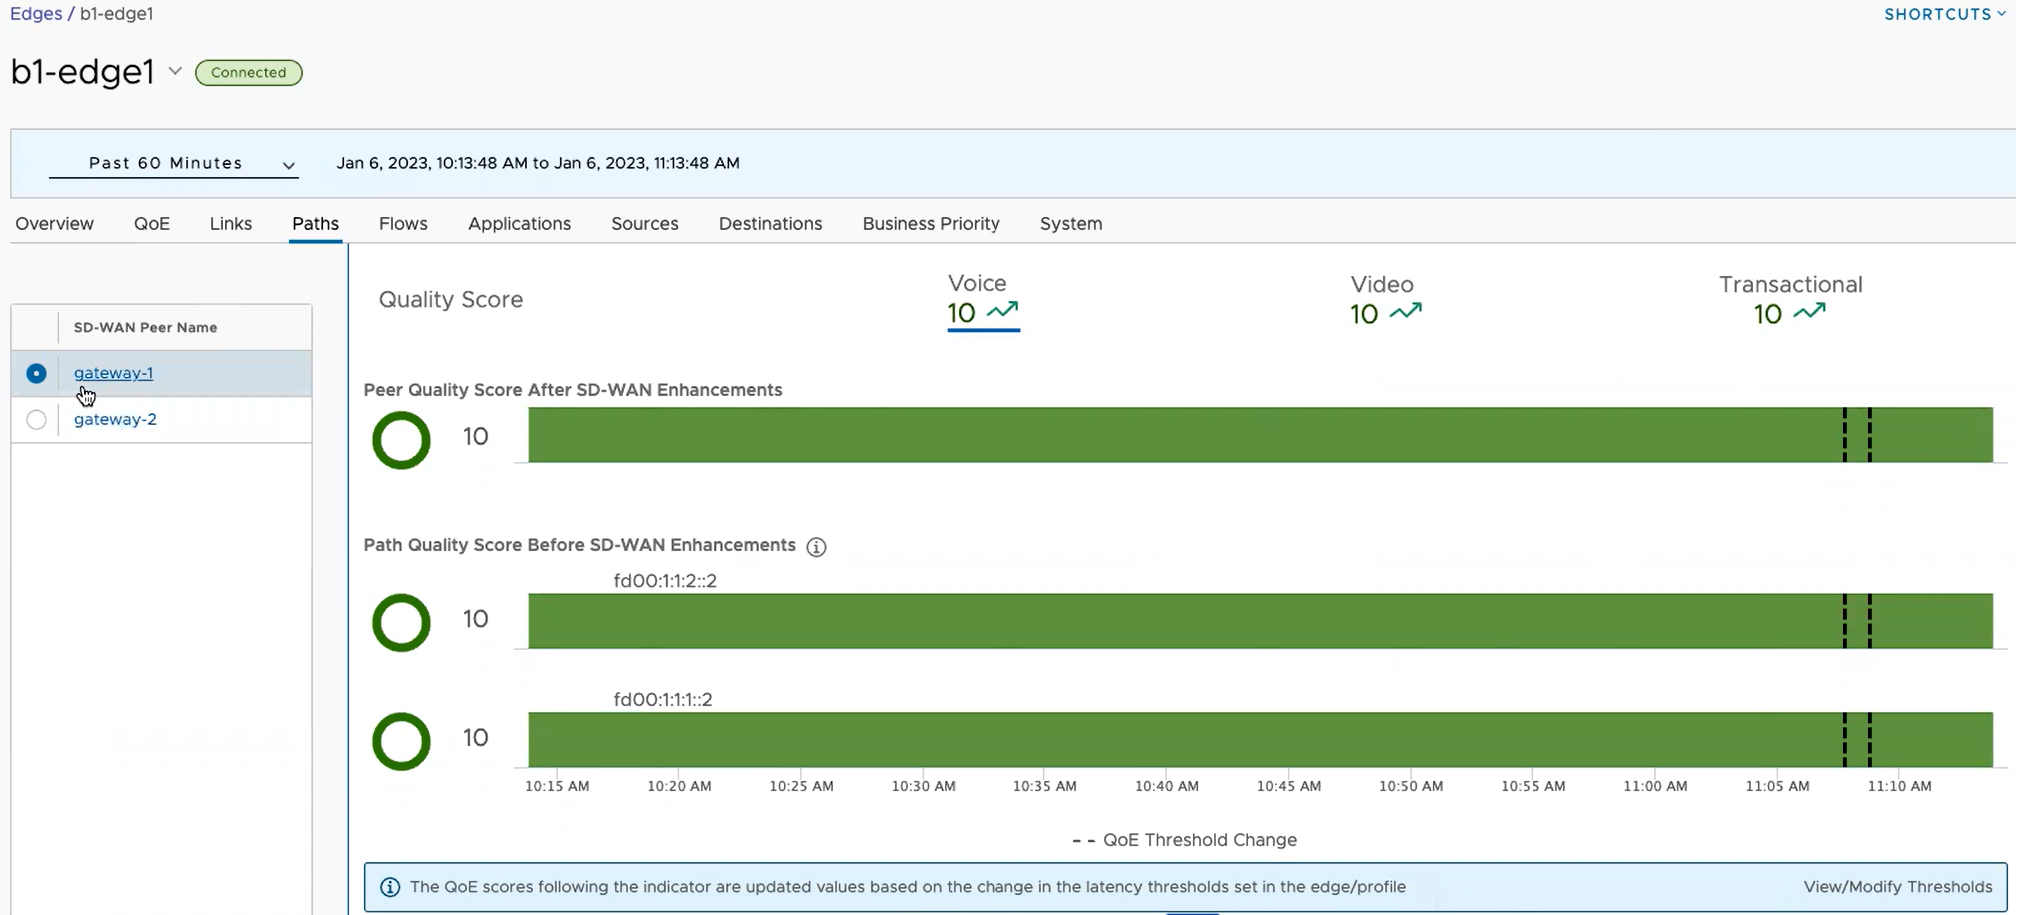
Expand the Quality Score pane at the top, to view the Path score by the traffic types.
You can click a VMware SD-WAN peer displayed in the left pane, to view the corresponding Path details.
A black vertical dotted line indicating an anchor, appears on the graph, whenever there is a threshold value change in a Profile or an Edge. You can hover the mouse on the anchor to see the modified latency threshold values for Voice, Video, and Transactional. To modify the threshold values, click the View/Modify Thresholds link located at the bottom of the screen, which directly takes you to the page.
