


The Firewall Logs page displays the details of firewall log originating from VMware SD-WAN Edges. Previously the only way a customer could store and view firewall logs was by forwarding them to a Syslog server. With Release 5.2.0 the customer has the option to store firewall logs on the Orchestrator where they can be be viewed, sorted, and searched on the Orchestrator UI. By default, Edges cannot send their Firewalls logs to Orchestrator. For an Edge to send the Firewall logs to Orchestrator, ensure that the “Enable Firewall Logging to Orchestrator” customer capability is activated at the Customer level under “Global Settings” UI page. Customers must contact their Operator if they want to activate the Firewall Logging feature. By default, Orchestrator retains the Firewall logs until it reaches the maximum retention time of 7 days or maximum log size of 15 GB on a rotation basis.
- In the SD-WAN service of the Enterprise portal, navigate to Monitor > Firewall Logs. The Firewall Logs page appears.
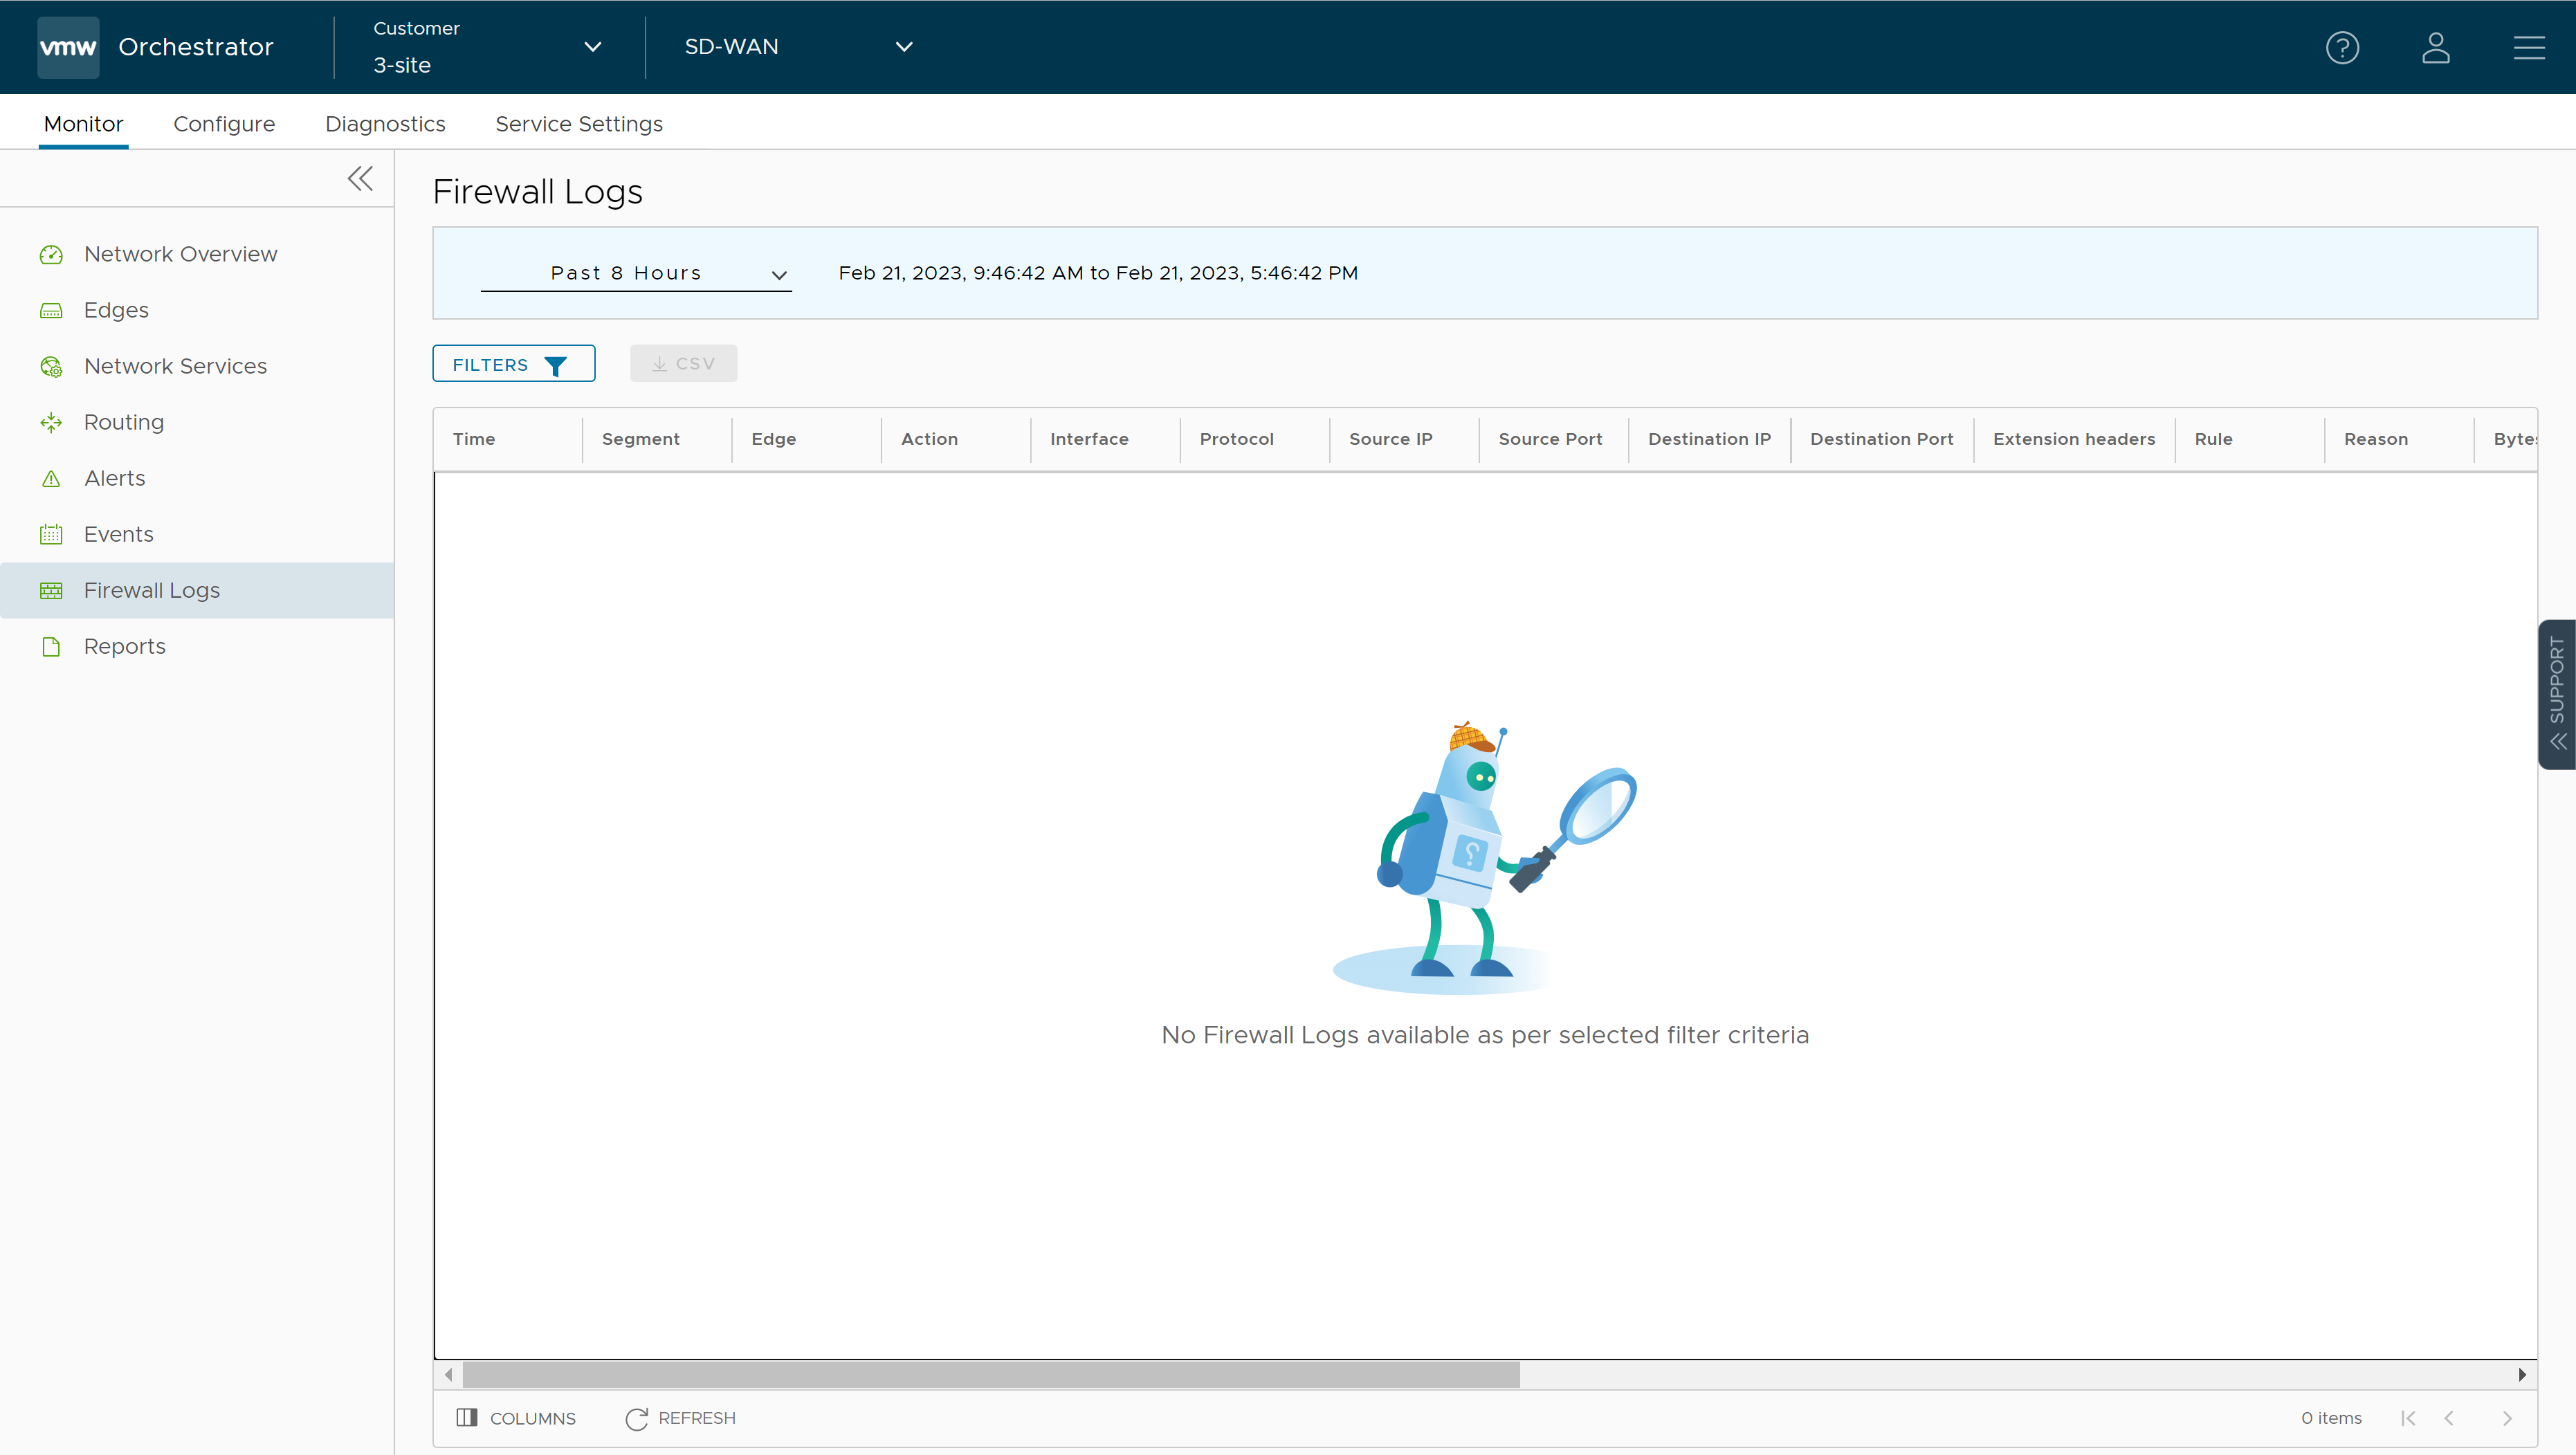
The page displays the following Edge Firewall Log details: Time, Segment, Edge, Action, Interface, Protocol, Source IP, Source Port, Destination IP, Destination Port, Extension Headers, Rule, Reason, Bytes Received, Bytes Sent, Duration, Application, Destination Domain, Destination Name, Session ID, Signature, IPS Alert, IDS Alert, Signature ID, Category, Attack Source, Attack Target, and Severity.
Note: Not all fields will be populated for all firewall logs. For example, Reason, Bytes Received/Sent and Duration are fields included in logs when sessions are closed. Signature, IPS Alert, IDS Alert, Signature ID, Category, Attack Source, Attach Target, and Severity are populated only for Enhanced Firewall Services (EFS) alerts, not for firewall logs.Firewall Logs are generated:- When a flow is created (on the condition that the flow is accepted)
- When the flow is closed
- When a new flow is denied
- When an existing flow is updated (due to a firewall configuration change)
EFS Alerts are generated:- Whenever the flow traffic matches any suricata signatures configured in the EFS engine.
- If firewall rule has only Intrusion Detection System (IDS) activated, the Edges detect if the traffic flow is malicious or not based on certain signatures configured in the engine. If attack is detected, the EFS engine generates an alert and sends the alert message to SASE Orchestrator/Syslog Server if Firewall logging is activated in Orchestrator, and will not drop any packets.
- If firewall rule has Intrusion Prevention System (IPS) activated, the Edges detect if the traffic flow is malicious or not based on certain signatures configured in the engine. If attack is detected, the EFS engine generates an alert and blocks the traffic flow to the client only if the signature rule has action as "Reject", matched by the malicious traffic. If the action in the signature rule is "Alert", the traffic will be allowed without dropping any packets even if you configure IPS.
- You can use the Filter options and select a filter from the drop-down menu to query the Firewall logs.
- Click the CSV option to download a report of the Edge Firewall Logs in CSV format.
