


You can view the detailed network usage by the system for a specific Edge.
To view the details of system information:
Procedure
- In the SD-WAN service of the Enterprise portal, click to view the Edges associated with the Enterprise.
- Click the link to an Edge and click the System tab.
Results
The System tab displays the details of network usage by the system for the selected Edge.
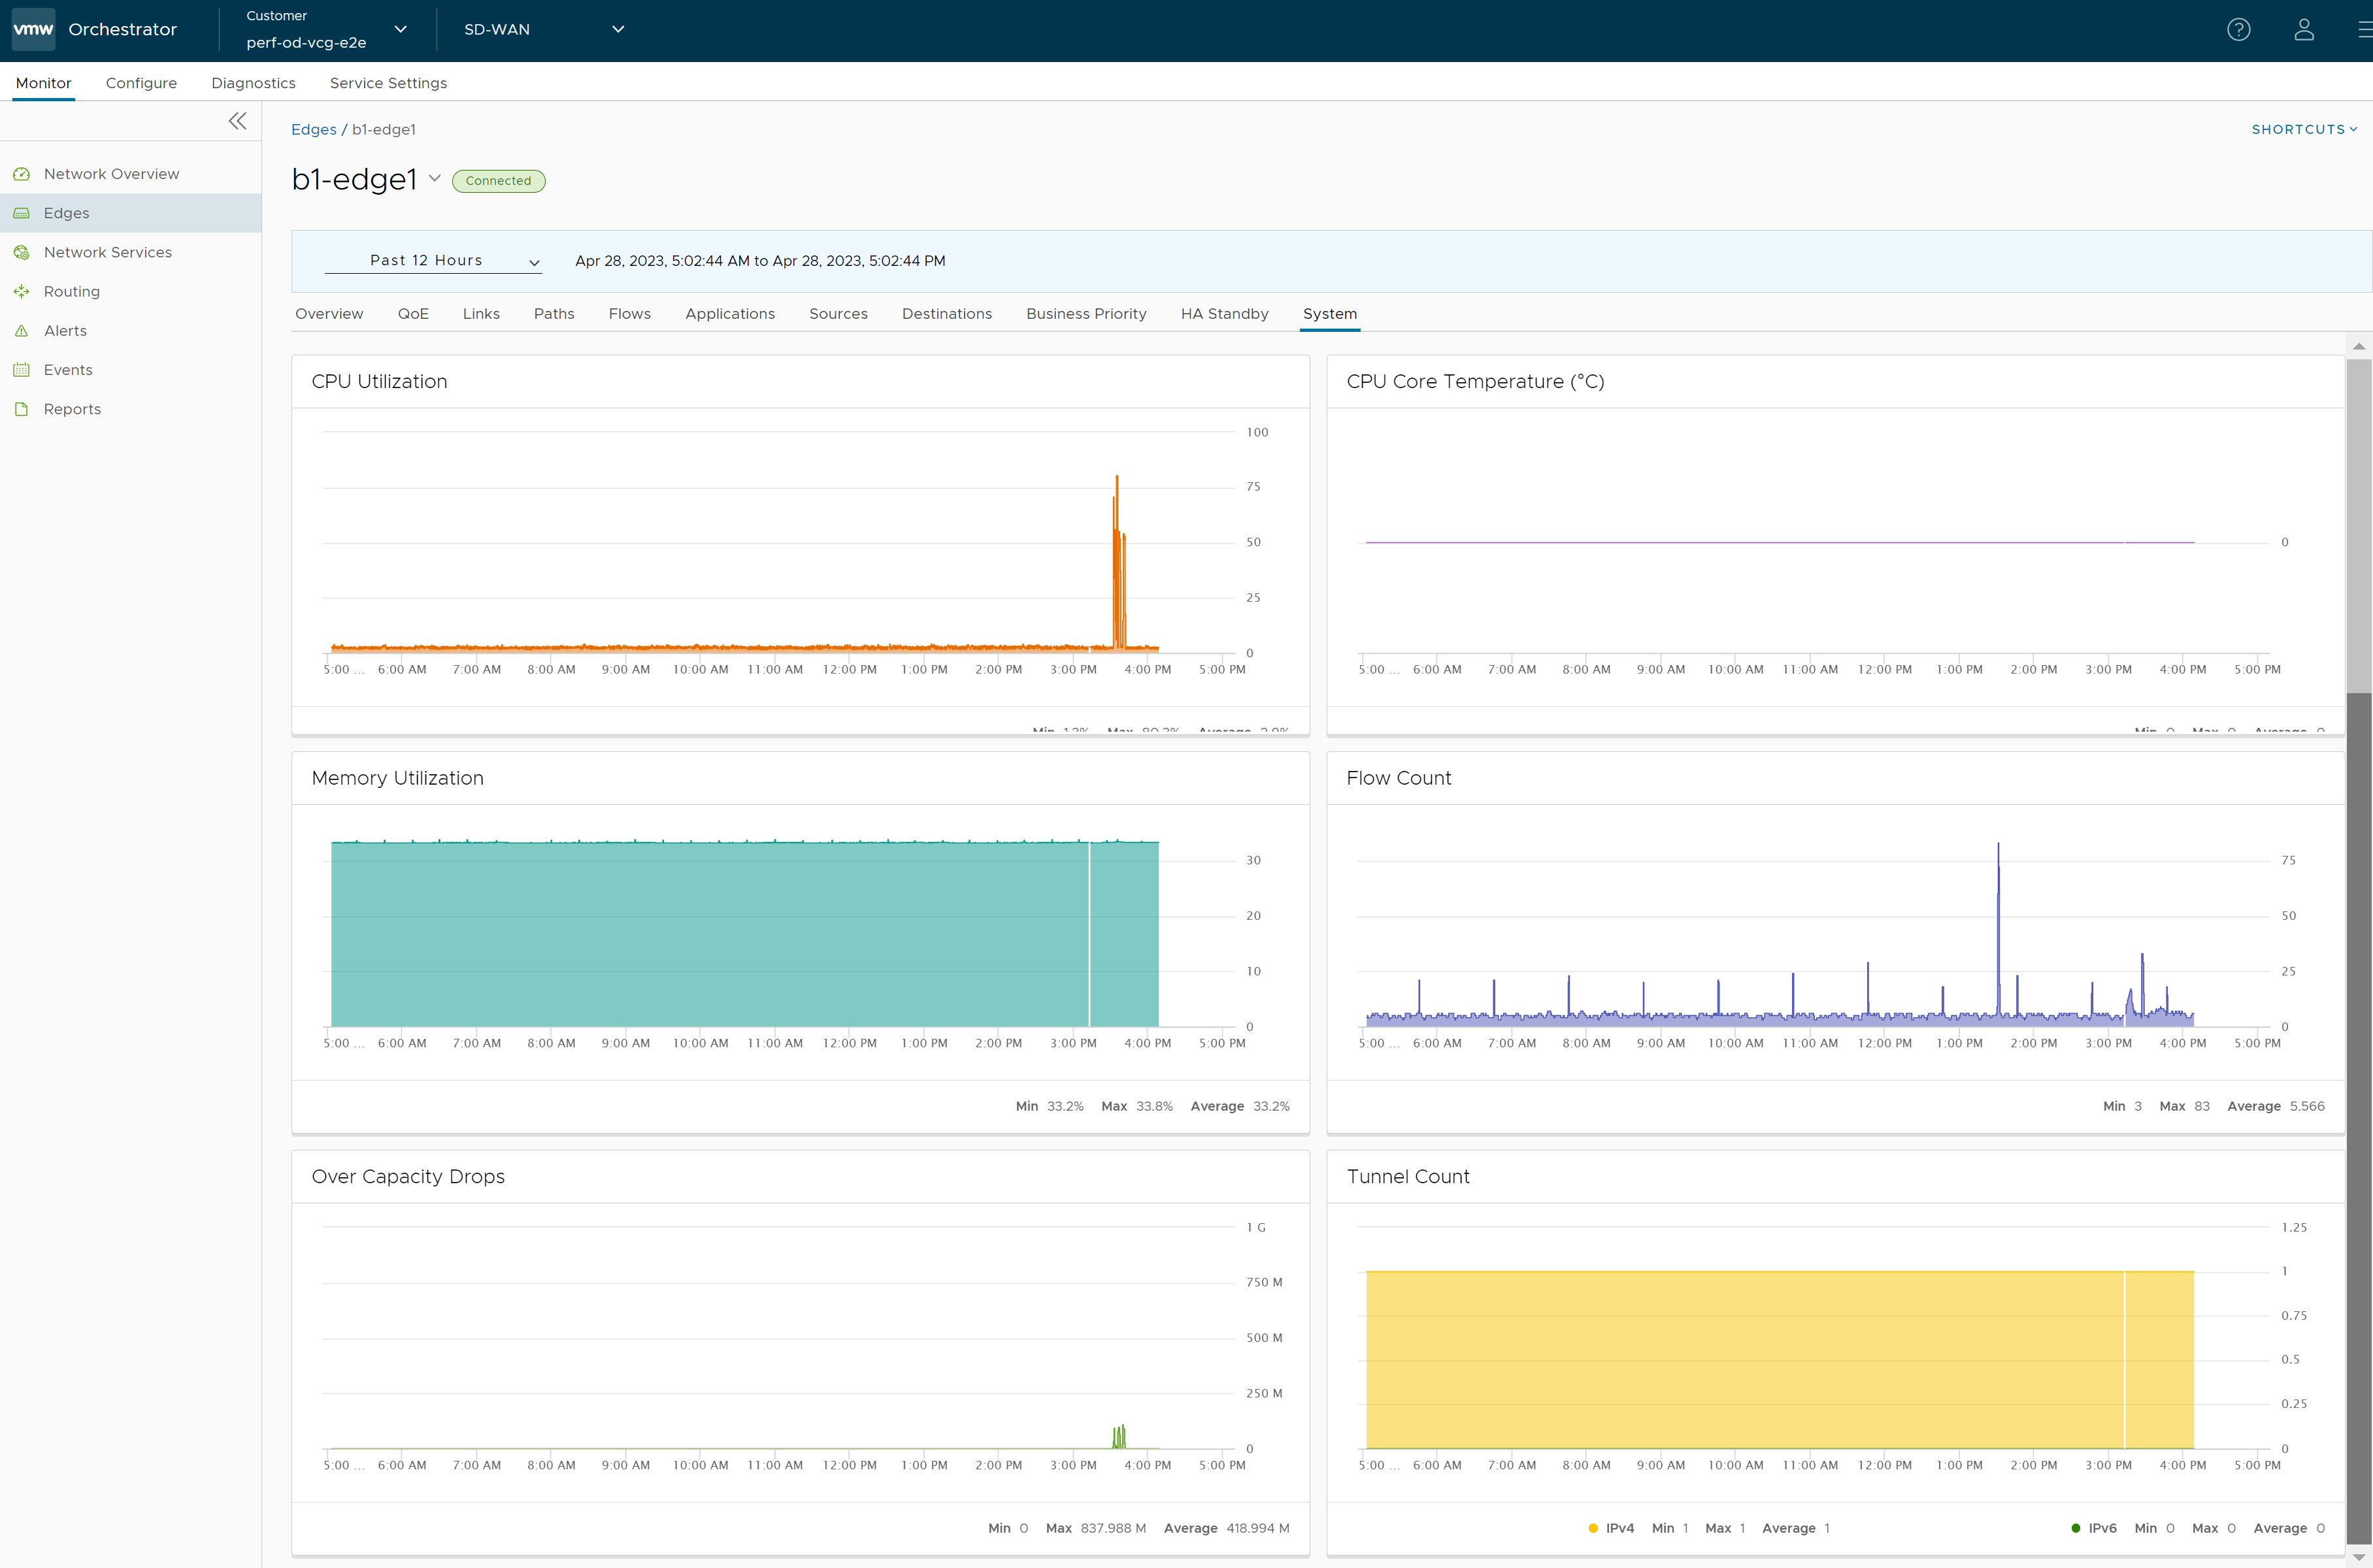
The page displays graphical representation of usage details of the following over the period of selected time duration, along with the minimum, maximum, and average values.
- CPU Utilization – Percentage of usage of CPU.
- CPU Core Temperature – The core temperature of the Edge CPU.
Note: The "CPU Core Temperature" feature is supported only for Edges running 5.1 and later versions.
- Memory Utilization– Percentage of usage of memory.
- Flow Count – Count of traffic flow.
- Over Capacity Drops – Total number of packets dropped due to over capacity since the last sync interval. Occasional drops are expected, usually caused by a large burst of traffic. However, a consistent increase in drops usually indicates an Edge capacity issue.
- Tunnel Count – Count of tunnel sessions.
Hover the mouse on the graphs to view more details.
