


This section provides information about the available options to monitor, backup, and upgrade Enterprise On-Premises deployments in a two-day operation scenario.
Overview
- Isolation of the solution: The VMware Cloud Operations team will not have access to apply hotfixes and upgrades.
- Restrictions on change management limit the frequency of patching and upgrades.
- Inadequate or insufficient solution monitoring: This situation may happen due to a lack of personnel capable of managing the infrastructure, resulting in functional issues, slower resolution of problems, and customer dissatisfaction.
This approach always requires a significant investment in people and time to manage, operate, and patch properly. The table below outlines some of the elements that must be considered when managing a system on-premises.
| System | Description | VMware Hosted Responsibility | On-Premises Responsibility |
|---|---|---|---|
| SD-WAN Orchestration | Application QoS and link steering policy | Yes | Yes |
| Security policy for apps and SD-WAN appliances | Yes | Yes | |
| SD-WAN appliance provisioning and troubleshooting | Yes | Yes | |
| Handling of SD-WAN alerting & events | Yes | Yes | |
| Link performance and capacity monitoring | Yes | Yes | |
| Hypervisor | Monitoring / alerting | No | Yes |
| Compute and memory resourcing | No | Yes | |
| Virtual networking and storage | No | Yes | |
| Backup | No | Yes | |
| Replication | No | Yes | |
| Infrastructure | CPU, memory, compute | No | Yes |
| Switching and routing | No | Yes | |
| Monitoring & management systems | No | Yes | |
| Capacity planning | No | Yes | |
| Software upgrades/patching | No | Yes | |
| Troubleshooting application/infrastructure issues | No | Yes | |
| Backup and Infrastructure DR | Backup infrastructure | No | Yes |
| Regular testing of backup regime | No | Yes | |
| DR infrastructure | No | Yes | |
| DR testing | No | Yes |
Two-day operation scenarios for Enterprise On-Premises deployments are explained in the two sections below, respectively (Day One Operations and Day Two Operations).
Day One Operations
Subscribe to Security Advisories
VMware Security Advisories document remediation for security vulnerabilities that are reported in VMware products. Please subscribe to the link below to receive an alert if an action is required in an on-prem component.
https://www.vmware.com/security/advisories.html
Deactivate Cloud-init on the SASE Orchestrator
The data-source contains two sections: meta-data and user-data. Meta-data includes the instance ID and should not change during the lifetime of the instance, while user-data is a configuration applied on the first boot (for the instance ID in meta-data).
After the first boot up, it is recommended to deactivate the cloud-init file to speed up the SASE Orchestrator boot sequence. To deactivate cloud-init, run:
./opt/vc/bin/cloud_init_ctl -d
It is not recommended to "purge" the cloud-init file with the command "apt purge cloud-init" (this procedure does not cause issues in the VMware SD-WAN Controller). Purging the cloud-init file also erases some essential SASE Orchestrator tools and scripts (for instance, the upgrade and backup scripts). In case the "purge" command was used, you can restore the files using the following commands:
- Go to the folder /opt/vcrepo/pool/main/v/vco-tools
- Install the SASE Orchestrator tool package from the folder: “sudo dpkg -i vco-tools_3.4.1-R341-20200423-GA-69c0f688bf.deb”. The vco-tools package name may change depending on your release. Please check the correct file name with the command "ls vco-tools."
NTP Timezone
The SASE Orchestrator and Gateway timezone must be set to "Etc/UTC."
vcadmin@vco1-example:~$ cat /etc/timezone
Etc/UTC
vcadmin@vco1-example:~$
echo "Etc/UTC" | sudo tee /etc/timezone
sudo dpkg-reconfigure --frontend noninteractive tzdata
NTP Offset
The expectation is that the NTP offset is <= 15 milliseconds.
vcadmin@vco1-example:~$ sudo ntpq -p
     remote           refid      st t when poll reach   delay   offset
jitter
==============================================================================
*ntp1-us1.prod.v 74.120.81.219    3 u  474 1024  377   10.171   -1.183   1.033
ntp1-eu1-old.pr .INIT.          16 u    - 1024    0    0.000    0.000   0.000
vcadmin@vco1-example:~$
sudo service ntp stop
sudo ntpdate <server>
sudo service ntp start
SASE Orchestrator Storage
When the SASE Orchestrator is initially deployed, three partitions are created: /, /store, /store2., /store3 (version 4.0 and onwards). The partitions are created with default sizes. Please follow the instructions in the section titled, "Increasing Storage in the SASE Orchestrator" for guidance in modifying the default sizes to match the design.
Additional Tasks
- Configure System Properties.
- Set up the initial Operator Profile.
- Set up Operator accounts.
- Create SD-WAN Gateways.
- Setup SASE Orchestrator.
- Create the customer account/partner account.
The configurations in the list above are out of this document's scope and can be found in the deployment guides in the VMware documentation. For detailed instructions, see Install SASE Orchestrator.
Day Two Operations
SASE Orchestrator Backup
This section provides the available mechanisms to periodically backup the SASE Orchestrator database to recover from Operator errors or catastrophic failure of both the Active and Standby Orchestrator.
Remember that the Disaster Recovery feature or DR is the preferred recovery method. It provides a Recovery Point Objective of nearly zero, as all configurations on the Active Orchestrator is instantly replicated. For more details on the Disaster recovery feature, refer to the next section.
Backup Using the Embedded Script
The SASE Orchestrator provides an in-built configuration backup mechanism to periodically Backup the configuration to recover from Operator errors or catastrophic failure of both the Active and Standby Orchestrator. The mechanism is script-driven and is located at /opt/vc/scripts/db_backup.sh.
The script essentially takes a database dump of the configuration data and events, while excluding some of the large monitoring tables during the database dump process. Once the script is executed, backup files are created in the local directory path provided as input to the above script.
The Backup consists of two .gzs files, one containing the database schema definition and the other one containing the actual data without definition. The administrator should ensure that the backup directory location has enough disk space for the Backup.
Best Practices
- Mount a remote location and configure the backup script to it. The remote location should have the same storage as /store if flows are also being Backup.
- Before using the Backup Script, check the Disaster Recovery (DR) replication status from the SASE Orchestrator replication page. They should be in sync, and no errors should be present.
- Additional to this, execute a MySQL query and check the replication lag.
- SHOW SLAVE STATUS \G
- In the above query, look at the field seconds_behind_master. Ideally, it should be zero, but under 10 would be sufficient as well.
- For the large SASE Orchestrators, it is recommended to use the Standby for the Backup script execution. There will be no difference in the Backup that is generated from both SASE Orchestrators.
Caveats- The Script only takes a backup of the configuration; flow stats or events are not included.
- Restoring the configuration requires assistance from the Support/Engineering team.
- How long does the Script take to run?
The duration of the Backup depends on the scale of the actual customer configuration. Since the monitoring tables are excluded from the Backup operation, it is expected that the configuration Backup operation will complete quickly. For a large SASE Orchestrator with thousands of SD-WAN Edge and lots of historical events, it could take up to an hour, while a smaller SASE Orchestrator should be completed within a few minutes.
- What is the recommended frequency to run the Backup script?
Depending on the size and time it takes to complete the initial backup, the Backup operation frequency can be determined. The Backup operation should be scheduled to run during off-peak hours to reduce the impact on SASE Orchestrator resources.
- What if the root filesystem doesn't have enough space for the backup?
It is recommended that other mounted volumes are used to store the backup. Note, it is not a best practice to use the root filesystem for the backup.
- How does one verify if the Backup operation completed successfully?
The script stdout and stderr should be sufficient to determine the success or failure of the Backup operation. If the script invocation is automated, the exit code can determine the Backup operation's success or failure.
- How is the configuration recovered?
Currently, VMware requires that the customer work with VMware Support to recover the configuration data. VMware Support will help to recover the customer's configuration. Customers should refrain from making any additional configuration changes until the configuration is restored.
- What is the exact impact of executing this Script?
Even though a backup of the configuration should have little impact on performance, there will be an increase in resource utilization for the MySQL process. It is recommended that the Backup be run during off-peak hours.
- Are any configuration changes allowed during the run of the Backup operation?
It is safe to make configuration changes while the Backup operation is running. However, to ensure up-to-date backups, it is recommended that no configuration operations are done while the Backup is running.
- Can the configuration be restored on the original SASE Orchestrator, or does it require a new SASE Orchestrator?
Yes, the configuration can, and ideally should, be restored on the same SASE Orchestrator if it is available. This will ensure that the monitoring data is utilized after the Restore operation is completed. If the original SASE Orchestrator cannot be recovered and the Standby Orchestrator is down, the configuration can be restored on a new SASE Orchestrator. In this instance, the monitoring data will be lost.
- What actions should be taken in case the configuration needs to be restored to a new SASE Orchestrator?
Please contact VMware Support for the recommended set of actions on the new SASE Orchestrator as the steps vary depending on the actual deployment.
- DoSD-WAN Edges have to re-register on the newly restored SASE Orchestrator?
No, SD-WAN Edges are not required to register on the new SASE Orchestrator, as all needed information is preserved as part of the Backup.
SASE Orchestrator Disaster Recovery
States
- Standalone (no DR configured)
- Active (DR configured, acting as the primary SASE Orchestrator server)
- Standby (DR configured, acting as an inactive replica SASE Orchestrator server)
- Zombie (DR formerly configured and Active, but no longer working as the Active or Standby)
| Phases | SASE Orchestrator A Role | SASE Orchestrator B Role |
|---|---|---|
| Initial | Standalone | Standalone |
| Pairing | Active | Standby |
| Failover | Zombie | Standalone |

- Locate the SASE Orchestrator DR in a geographically separate datacenter.
- Before promoting a Standby Orchestrator as Active, confirm that the DR replication Status is in Sync. The previously Active Orchestrator will no longer be able to manage the inventory and configuration.
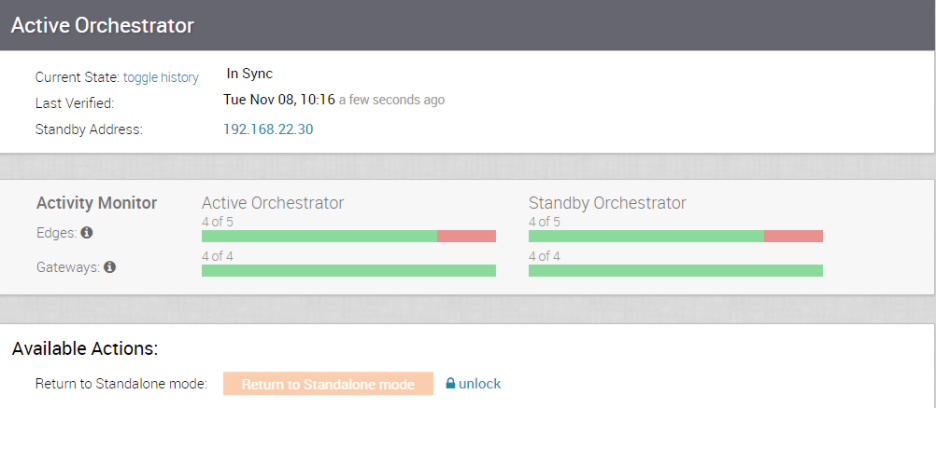
- If the Standby can communicate with the formerly Active Orchestrator, it will instruct that Orchestrator to enter a Zombie state. In the Zombie state, the SASE Orchestrator communicates with its clients (SD-WAN Edges, SD-WAN Gateways, UI/API) that it is no longer Active, and they must communicate with the newly promoted SASE Orchestrator.
- If the promoted Standby cannot communicate with the formerly Active Orchestrator, the Operator should, if possible, manually demote the previously Active. For detailed instructions, see Configure SASE Orchestrator Disaster Recovery.
Upgrade Procedure for the SASE Orchestrator
- VMware Support will assist with the upgrade. Collect the following information before contacting VMware Support.
- Provide the current and target SASE Orchestrator versions, for example, the current version (i.e., 3.4.2), target version (3.4.3).
Note: For the current version, this information can be found on the top, right corner of the SASE Orchestrator by clicking the Help link and choosing About.
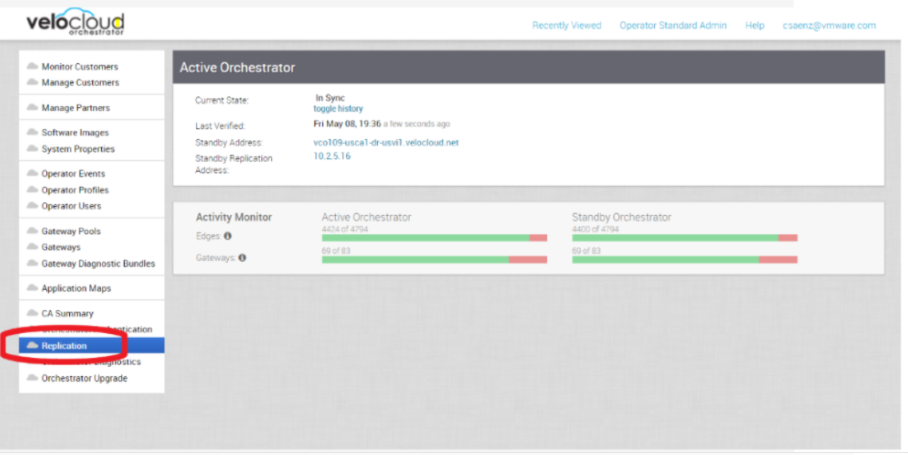
- Provide a screenshot of the replication dashboard of the SASE Orchestrator, as shown below.
- Hypervisor Type and version (i.e., vSphere 6.7)
- Commands from the SASE Orchestrator (Commands must be run as root (e.g. 'sudo <command>' or 'sudo -i'). ):
- LVM layout
- pvdisplay -v
- vgdisplay -v
- lvdisplay -v
- df -h
- cat /etc/fstab
- Memory information
- free -m
- cat /proc/meminfo
- ps -ef
- top -b -n 2
- CPU Information
- cat /proc/cpuinfo
- Copy of /var/log
- tar -czf /store/log-`date +%Y%M%S`.tar.gz --newer-mtime="36 hours ago" /var/log
- From the Standby Orchestrator:
- sudo mysql --defaults-extra-file=/etc/mysql/velocloud.cnf velocloud -e 'SHOW SLAVE STATUS \G'
- From the Active Orchestrator:
- sudo mysql --defaults-extra-file=/etc/mysql/velocloud.cnf velocloud -e 'SHOW MASTER STATUS \G'
- LVM layout
- Provide the current and target SASE Orchestrator versions, for example, the current version (i.e., 3.4.2), target version (3.4.3).
- Contact VMware SD-WAN Support at https://knowledge.broadcom.com/external/article?legacyId=53907 with the above-mentioned information for assistance with the SASE Orchestrator upgrade.
- ESXi Snapshot guidelines are provided in the next section in case the customer wants a quick rollback solution after an upgrade.
ESXi Snapshot
The ESXi snapshot capability can be used before the SASE Orchestrator upgrades to provide a quick rollback to the previous SASE Orchestrator version.
ESXi Snapshot Best Practices
- Standby and Active Orchestrator must be powered off before performing or restoring from the Snapshot to avoid any database inconsistencies.
- All Snapshot-related tasks must be done in the Standby and Active Orchestrator to avoid any database inconsistencies.
- It is essential to consolidate the Snapshot if the upgrade process was successful. The snapshot file continues to grow when it is retained for a more extended period. This can cause the snapshot storage location to run out of space and impact the system performance.
- Deactivate alerting in the SASE Orchestrator while creating snapshots to avoid false alarms.
- Do not use a single snapshot for more than 72 hours.
- It is not recommended to use Snapshots as backups.
- Feature validation was done with ESXi 6.7 and SASE Orchestrator version 3.4.4.
VMware Snapshot best practices can be found in the following KB article.
Create ESXi Snapshot
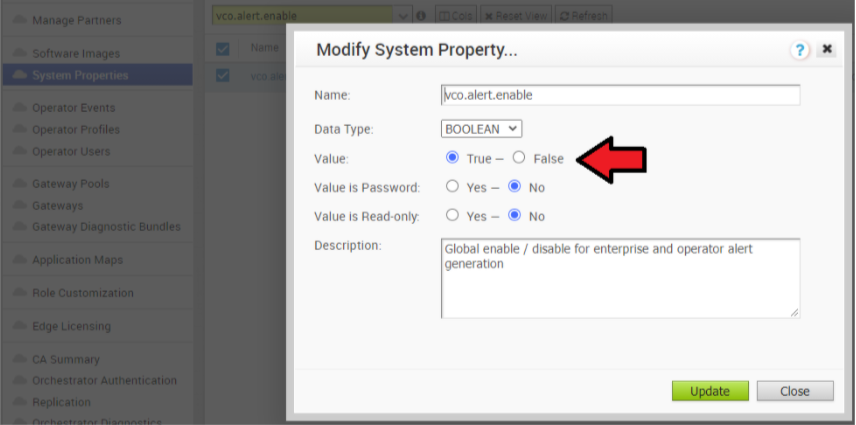
- Deactivate alert, notification, and monitoring System Properties on the Active Orchestrator. The approximate duration is 10 Minutes.
- In the Operator portal, click System Properties. Change the following System Properties to false.
- vco.alert.enable
- vco.notification.enable
- vco.monitor.enable

- In the Operator portal, click System Properties. Change the following System Properties to false.
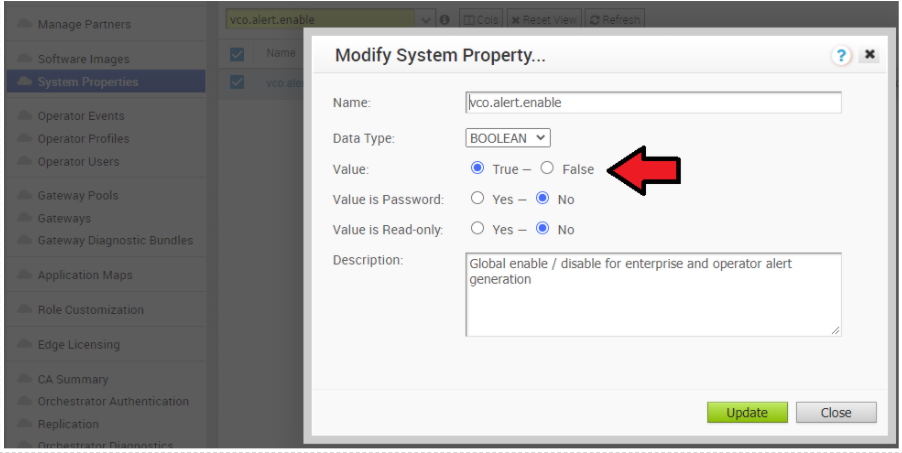
- Deactivate alert, notification, and monitoring System Property on the Standby Orchestrator.
- Change the following System Properties to false.
- vco.alert.enable
- vco.notification.enable
- vco.monitor.enable
- Change the following System Properties to false.
- Power off the Active Orchestrator.
Go to ESXi/vCenter → Orchestrator VM → Actions → Power → Power Off.
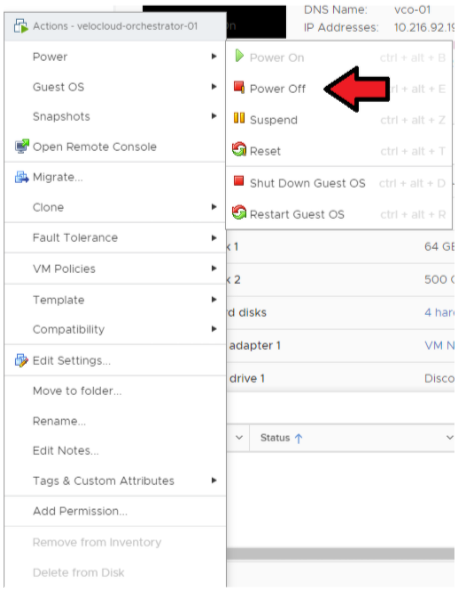
- Power off the Standby Orchestrator.
Go to ESXi/vCenter → Orchestrator VM → Actions → Power → Power Off
- Take a Snapshot of the Active Orchestrator. Confirm that the VM is powered off before performing this step.
Go to ESXi → Orchestrator VM → Actions → Power → Snapshots → Take Snapshot.
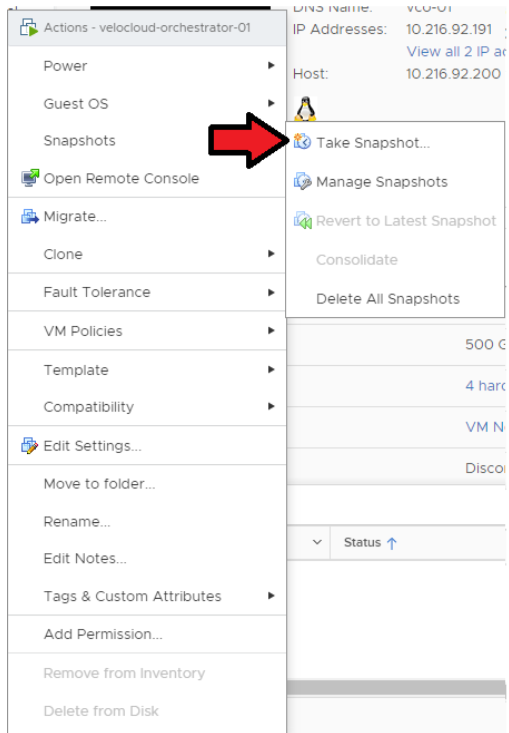
- Take a Snapshot of Standby Orchestrator. Confirm that the VM is powered off before performing this step.
Go to ESXi → Orchestrator VM → Actions → Power → Snapshots → Take Snapshot.
Consolidation of the ESXi Snapshot
- After confirming a successful upgrade on the Active and Standby Orchestrators, you can consolidate the Snapshots starting with the Active Orchestrator.
Go to ESXi → Orchestrator VM → Actions → Snapshots → Snapshot Manager → Delete All.
- Consolidate the Snapshot in the Standby Orchestrator.
Go to ESXi → Orchestrator VM → Actions → Snapshots → Snapshot Manager → Delete All.
- Re-enable alert, notification, and monitoring System Properties on the Active Orchestrator and the Standby Orchestrator.
In the Operator portal, click System Properties. Change the following system properties to true.
- vco.alert.enable
- vco.notification.enable
- vco.monitor.enable
- If the Delete All snapshots do not work with vSphere 6.x/7.x, you can try to Consolidate Snapshots. For more information, see the Consolidate Snapshots section in the vSphere Product Documentation.
Restore from the ESXi Snapshot
- Power off the Active Orchestrator.
Go to ESXi/vCenter → Orchestrator VM → Actions → Power → Power Off.

- Power off the Standby Orchestrator.
Go to ESXi/vCenter → Orchestrator VM → Actions → Power → Power Off.
- Restore the Snapshot of the Active Orchestrator.
Go to ESXi → Orchestrator VM → Actions → Power → Snapshots → Manage Snapshots.
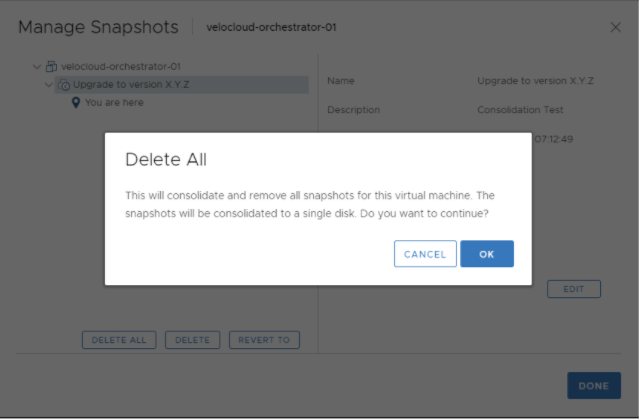
Select the Snapshot you want to restore the VM → Revert to (see image below).

- Restore the Snapshot of Standby Orchestrator.
Go to ESXi → Orchestrator VM → Actions → Power → Snapshots → Manage Snapshots.
Select the Snapshot you want to restore the VM → Revert to.
- Re-enable the alert, notification, and monitoring System Properties on the Active Orchestrator and the Standby Orchestrator. In the Operator portal, click System Properties. Change the following System Properties to true.
- vco.alert.enable
- vco.notification.enable
- vco.monitor.enable
Controller Minor Software Upgrade (Ex. from 3.3.2 P3 to3.4.4)
The software upgrade file contains Gateway and system updates. Do NOT run ‘apt-get update && apt-get –y upgrade.’
Before proceeding with the VMware SD-WAN Controller's upgrade, ensure that the SASE Orchestrator was upgraded before to the same or a higher version.
- Download the SD-WAN Controller update package.
- Upload the image to the SD-WAN Controller storage (using, for example, the SCP command). Copy the image to the following location on the system: /var/lib/velocloud/software_update/vcg_update.tar.
- Connect to the SD-WAN Controller console and run:
sudo /opt/vc/bin/vcg_software_update
root@VCG:/var/lib/velocloud/software_update# wget -O 'vcg_update.tar' <image location>
Resolving ftpsite.vmware.com (ftpsite.vmware.com)...
Connecting to ftpsite.vmware.com (ftpsite.vmware.com)| <ip address>|:443... connected.
HTTP request sent, awaiting response... 200 OK
Length: unspecified [application/octet-stream]
Saving to: 'vcg_update.tar'
    [                                  <=>  ] 325,939,200 3.81MB/s   in 82s
2020-05-23 21:59:27 (3.79 MB/s) - ‘vcg_update.tar’ saved [325939200]
root@VCG:/var/lib/velocloud/software_update# sudo /opt/vc/bin/vcg_software_update
=========== VCG upgrade: Sat May 23 22:08:15 UTC 2020
Upgrading gateway version 3.4.0-106-R340-20200218-GA-c57f8316dd to 3.4.1-39-R341-20200428-GA-44354-44451-596496a88a
Ign file: trusty InRelease
Ign file: trusty Release.gpg
Get: 1 file: trusty Release [2,668 B]
Ign file: trusty/main Translation-en_US
Ign file: trusty/main Translation-en
(...)
Writing extended state information...
Reading package lists...
Building dependency tree...
Reading state information...
Reading extended state information...
Initializing package states...
update-initramfs: Generating /boot/initrd.img-3.13.0-176-generic
Reboot is required. Reboot? (y/n) [y]:
Controller major software upgrade (Ex from 3.3.2 or 3.4 to 4.0)
- A new system disk layout based on LVM to allow more flexibility in volume management
- A new kernel version
- New and upgraded base OS packages
- Improved security hardening based on the Center for Internet Security benchmarks
Due to these changes, the standard upgrade procedure which uses the upgrade script does not work. A particular upgrade procedure is required. It is in the product manual below. This procedure is to replace the 3.3.2 or 3.4 Gateway VM with the new 4.0 Gateway VM. Refer to the following document: VMware SD-WAN Partner Gateway Upgrade and Migration 3.3.2 or 3.4 to 4.0
This upgrade procedure requires SASE Orchestrator system property configuration, which only SASE Orchestrator Operator accounts can run. Please create a support ticket with the VMware Support team to request the System Property change.
Monitoring
- SD-WAN Controller Monitoring
You can monitor the status and usage data of Controllers available in the Operator portal.
The procedure is as follows:
- In the Operator portal, click Gateways.
- The Gateways page displays the list of available Controllers.
- Click the link to a Gateway. The details of the selected Controller displays.
- Click the Monitor tab to view the usage data of the selected Controller.
The Monitor tab of the selected Controller displays the following details as shown in the image below.
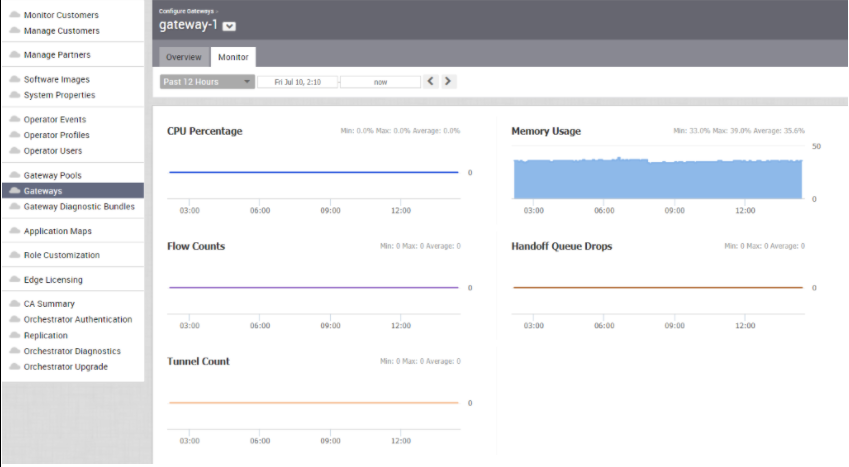
You can choose a specific period to view the Controller's details for the selected duration at the top of the page.
The page displays a graphical representation of usage details of the following parameters for the period of selected time duration, along with the minimum, maximum, and average values.
| Usage | Description |
|---|---|
| CPU Percentage | Percentage of usage of CPU |
| Memory Usage | Percentage of usage of memory |
| Flow Counts | Count of traffic flow |
| Handoff Queue Drops | Count of packets dropped due to queued handoff |
| Tunnel Count | Count of tunnel sessions |
- SD-WAN Gateway Controller Recommended Values to Monitor
The following list shows values that should be monitored and their thresholds. The list below is given as a start point, and it is not exhaustive. Some deployments may require assessing additional components such as flows, packet loss, etc.
Whenever a warning threshold is reached, it is recommended to review the current device scale configuration and add more resources if required. When a critical alarm is triggered, it is crucial to contact VMware Support representatives to check the solution and provide further advice.
Table 4. Recommended Values to Monitor Service Check Service Check Description Warn Threshold Critical Threshold CPU Load Check System Load. 60 80 Memory Checks the memory utilization buffer, cache, and used memory. 70 80 Tunnels Number of tunnels from connected SD-WAN Edges. 60% of max Scale 80% of max Scale Note: A sudden loss of all tunnels or an abnormal low quantity should also be a concern.
Handoff Drops Due to the busy nature of traffic through a Controller, occasional drops are expected. Consistent drops in specific queues may indicate a capacity problem. Disk Space Current disk utilization 40% Free 20% Free Controller NTP Check for Time offset Offset of 5 Seconds Offset of 10 Seconds
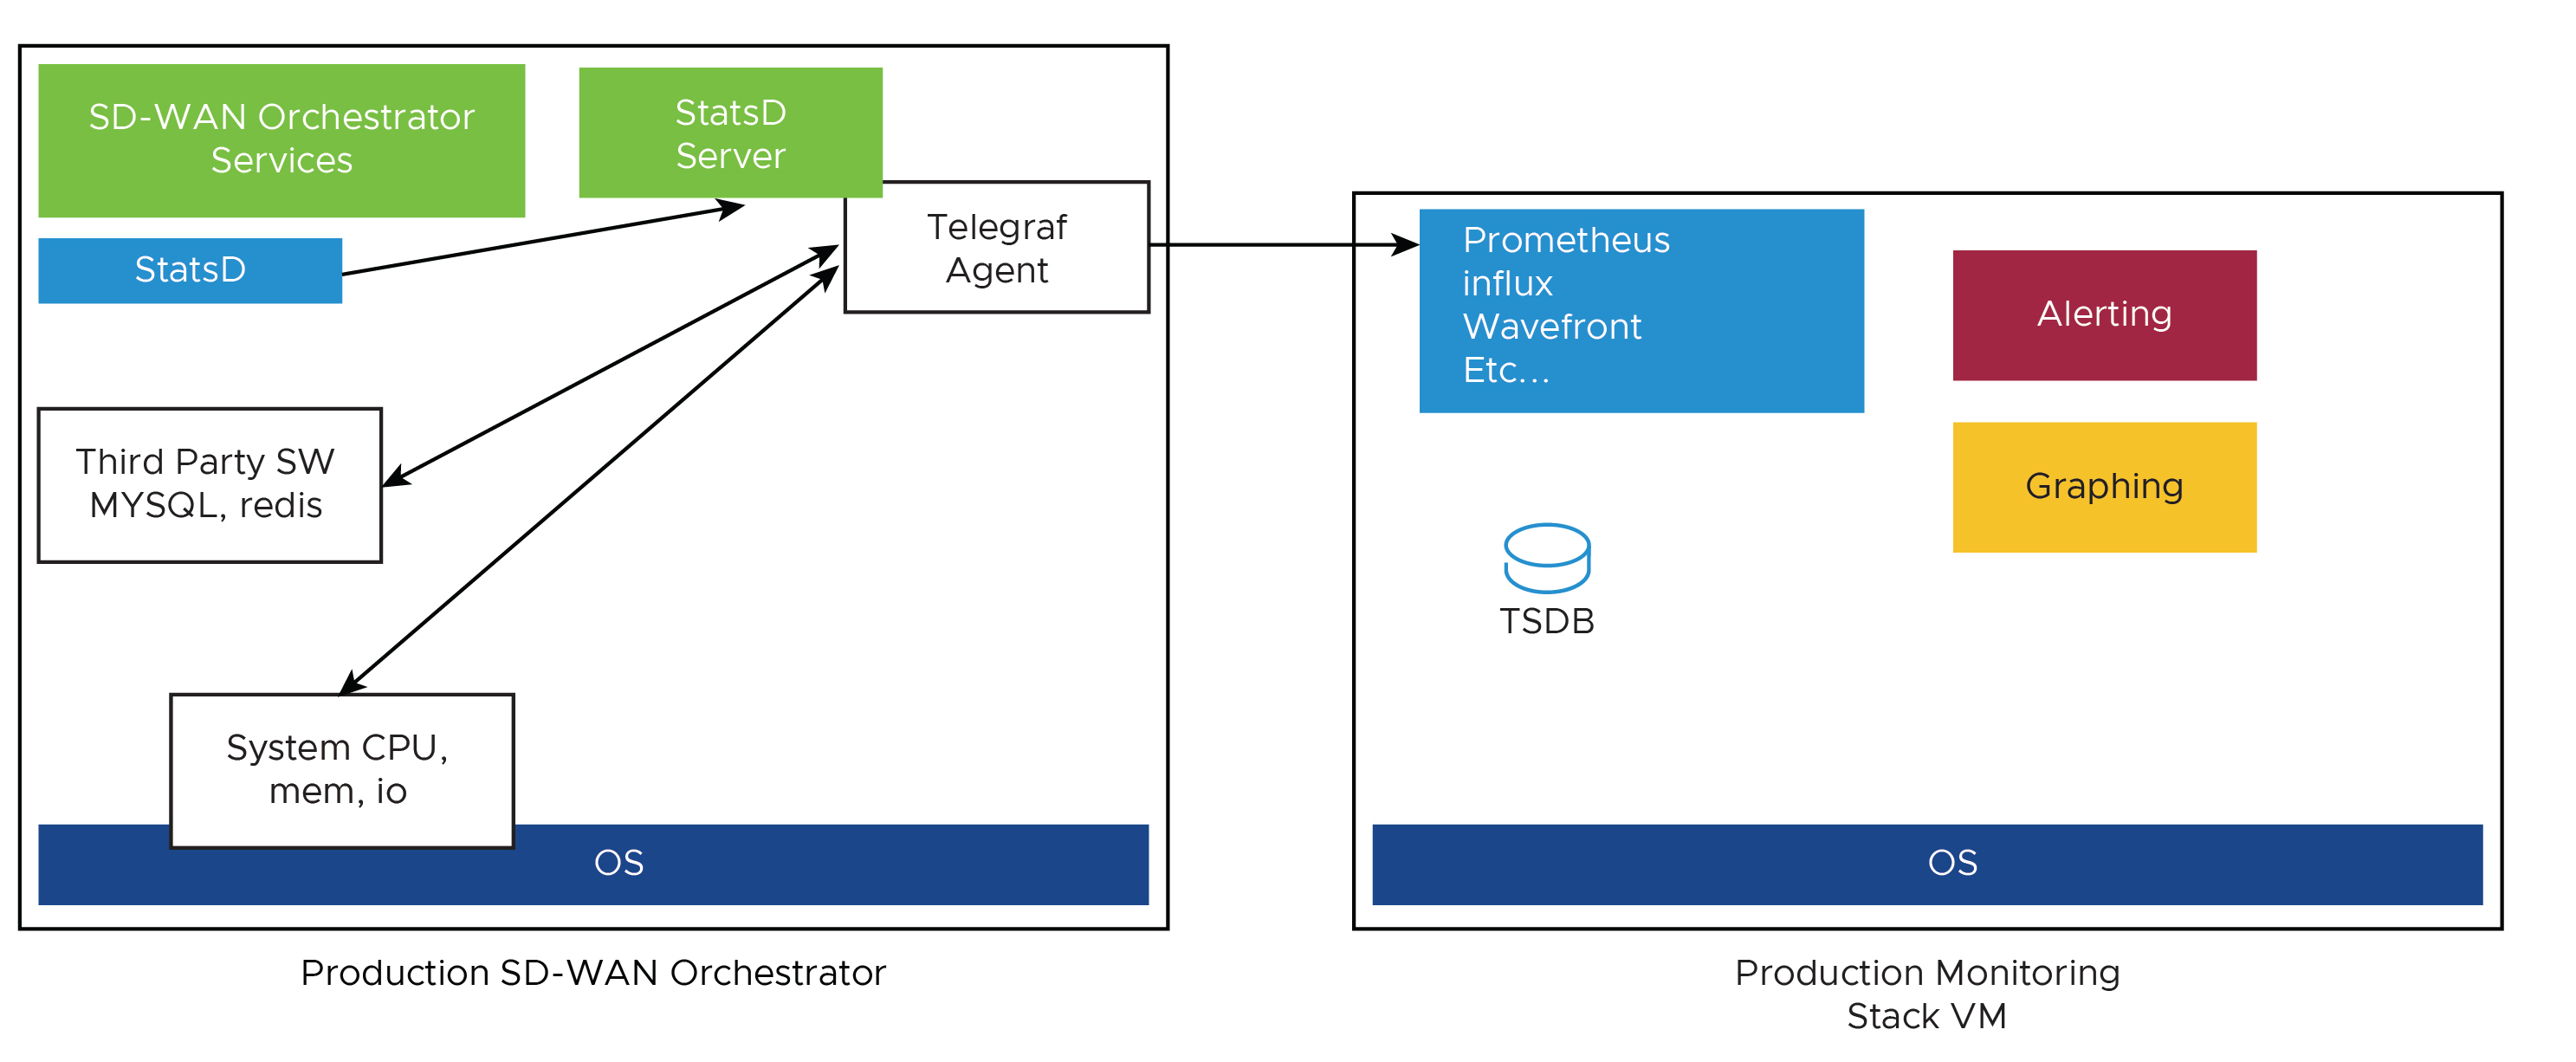
- SASE Orchestrator Integration with Monitoring Stacks
The SASE Orchestrator comes with a built-in system metrics monitoring stack, which can attach to an external metrics collector and a time-series database. With the monitoring stack, you can quickly check the health condition and the system load for the SASE Orchestrator.
-
- To enable the monitoring stack, run the following command on the orchestrator:
sudo /opt/vc/scripts/vco_observability_manager.sh enable
- To check the status of the monitoring stack, run:
sudo /opt/vc/scripts/vco_observability_manager.sh status
- To deactivate the monitoring stack, run:
sudo /opt/vc/scripts/vco_observability_manager.sh disable
- To enable the monitoring stack, run the following command on the orchestrator:
- The Metrics Collector
Telegraf is used as the SASE Orchestrator system metrics collector, which has plenty of plugins to collect different system metrics. The following metrics are enabled by default.
Table 5. Metrics Collector Metric Name Description Supported in Version inputs.cpu Metrics about CPU usage. 3.4/4.0 inputs.mem Metrics about memory usage. 3.4/4.0 inputs.net Metrics about network interfaces. 4.0 inputs.system Metrics about system load and uptime. 4.0 inputs.processes The number of processes grouped by status. 4.0 inputs.disk Metrics about disk usage. 4.0 inputs.diskio Metrics about disk IO by device. 4.0 inputs.procstat CPU and memory usage for specific processes. 4.0 inputs.nginx Nginx's basic status information (ngx_http_stub_status_module). 4.0 inputs.mysql Statistic data from MySQL server. 3.4/4.0 inputs.redis Metrics from one or many redis servers. 3.4/4.0 inputs.statds API and system metrics. 3.4/4.0 (additional metrics are included in 4.0) inputs.filecount The number and the total size of files in specified directories. 4.0 inputs.ntpq Standard NTP query metrics, requires ntpq executable. 4.0 Inputs.x509_cert Metrics from a SSL certificate. 4.0 To activate more metrics or deactivate some enabled metrics, you can edit the Telegraf configuration file on the SASE Orchestrator by:
sudo vi /etc/telegraf/telegraf.d/system_metrics_input.conf
sudo systemctl restart telegraf
- The Time-series Database
A time Series Database can be used to store the system metrics collected by Telegraf. A time-series database (TSDB) is a database optimized for time series data.
- Dashboard and Alerting Agent
The Dashboard and Alerting Agent allows you to query, visualize, alert, and explore the data stored in the TSDB. The image is an example of a dashboard using Telegraph (a TSDB and a dashboard engine) that can be created to monitor the solution.

- Time-series Database Setup
Follow the instructions below to setup the time-series database.
- Add the iptables entry to allow for external monitoring systems to access to telegraf port. The source IP address should be specified for security reasons.
- Example. The IP address of the external monitoring system is 191.168.0.200 Add "-A INPUT -p tcp -m tcp --source 191.168.0.200 --dport 9273 -m comment --comment "allow telegraf port" -j ACCEPT" to /etc/iptables/rules.v4
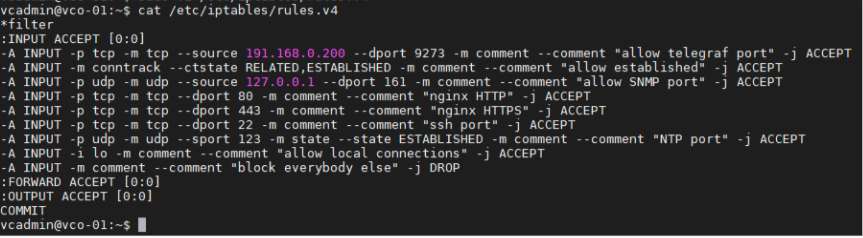
- Restart iptables.
sudo service iptables-persistent restart (Orchestrator 3.4.x)
sudo systemctl restart netfilter-persistent (Orchestrator 4.x)
- Make sure the iptables entry is added.
- Example. The IP address of the external monitoring system is 191.168.0.200 Add "-A INPUT -p tcp -m tcp --source 191.168.0.200 --dport 9273 -m comment --comment "allow telegraf port" -j ACCEPT" to /etc/iptables/rules.v4
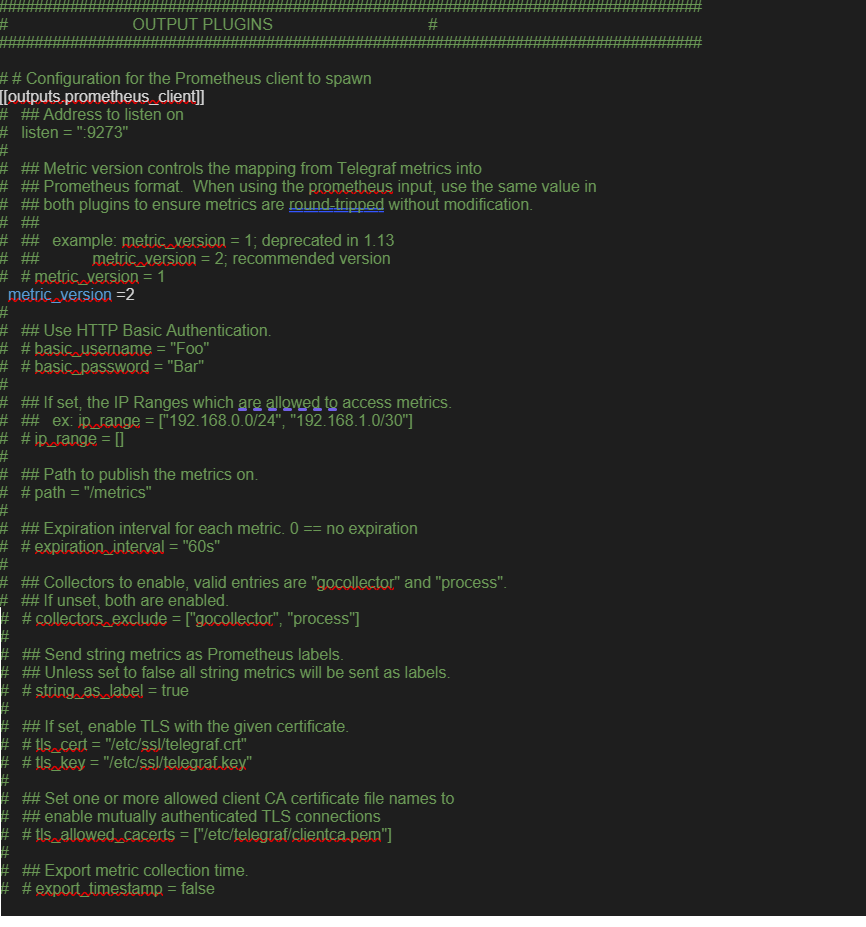
- Add the time-series database details in the telegraf configuration. Create an output configuration file. Example with prometheus is as follows:
/etc/telegraf/telegraf.d/prometheus_out.conf
- SASE Orchestrator Recommended Values to Monitor
The following list shows a list of values that should be monitored and their thresholds. The list below is given as a starting point, as it is not exhaustive. Some deployments may require assessing additional components such as database transactions, automatic backups, etc.
Whenever a warning threshold is reached, it is recommended to review the current device scale configuration and add more resources if required. When a critical alarm is triggered, it is crucial to contact the VMware Support representatives to check the solution and give further advice.Table 6. Monitor Values and Thresholds Service Check Service Check Description Warn Threshold Critical Threshold CPU Load Check System Load – Telegraf input plugin: inputs.cpu. 60 70 Memory Checks the memory utilization buffer, cache, and used memory – Telegraf input plugin: inputs.memory. 70 80 Disk Usage Disk Utilization in the different Orchestrator partitions, /, /store, /store2 and /store3 (version 4.0 and onwards) – Telegraf input plugin: inputs.disk (version 4.0 and onwards). 40% Free 20% Free MySQL Server Checks MySQL Connections -Telegraf input plugin: inputs.mysql. Above 80% of max connection define in mysql.conf(/etc/mysql/my.cnf) SASE Orchestrator Time Check for Time offset -Telegraf input plugin: inputs.ntpq (version 4.0 and onwards). Offset of 5 Seconds Offset of 10 Seconds SASE Orchestrator SSL Certificate Checks Certificate Expiration - Telegraf input plugin: inputs.x509_cert (version 4.0 and onwards). 60 Days 30 Days SASE Orchestrator Internet (not applicable for MPLS only topologies) Check for Internet access. Response time > 5 secs Response time > 10 secs SASE Orchestrator HTTP Make sure HTTP on localhost is responding. The localhost is not responding. SASE Orchestrator Total Cert Count Check Total – Example mysql query: SELECT count(id) FROM VELOCLOUD_EDGE_CERTIFICATE WHERE validFrom <= NOW() AND validTo >=NOW()', 'SELECT count(id) FROM VELOCLOUD_GATEWAY_CERTIFICATE WHERE validFrom <= NOW() AND validTo >=NOW()
CRL When Total Cert count exceeds 5000 DR Replication Status Confirm the Standby Orchestrator is up-to-date. Review that the DR SASE Orchestrator is no more than 1000 seconds behind the Active Orchestrator. Seconds_Behind_Master: from mysql command: show slave STATUS\G;
DR Replication SD-WAN Edge Gateway delta Confirm that SD-WAN Edges and SD-WAN Gateways can talk to the DR SASE Orchestrator. Different values between the Active and the Standby Orchestrators can be due to a difference in the timezone in SD-WAN Edges and SD-WAN Gateways.
The same amount of SD-WAN Edges talking with the Active Orchestrator should be able to reach the Standby Orchestrator. This value can be checked on the "replication" tab or via the API.
API Best Practices
- The SASE Orchestrator Portal
The SASE Orchestrator Portal allows network administrators (or scripts and applications acting on their behalf) to manage network and device configuration and query the current or historical network and device state. API clients may interact with the Portal via a JSON-RPC interface or a REST-like interface. It is possible to invoke all of the methods described in this document using either interface. There is no Portal functionality for which access is constrained exclusively to either JSON-RPC clients or REST-like ones.
Both interfaces accept exclusively HTTP POST requests. Both also expect that request bodies, when present, are JSON-formatted -- consistent with RFC 2616, clients are furthermore likely to formally assert where this is the case using the Content-Type request header, e.g., Content-Type: application/json.
More information about the VMware SD-WAN API can be found here:
- Best Practices for enterprises and service providers Using APIs
Some of the best practices while using APIs are:
- Wherever possible, aggregate API calls should be preferred to enterprise-specific ones. e.g., a single call to monitoring/getAggregateEdgeLinkMetrics may be used to retrieve transport stats across all SD-WAN Edges concurrently.
- VMware requests that clients limit the number of API calls in flight at any given time to no more than a handful (i.e., <2-4). If a user feels there is a compelling reason to parallelize API calls, VMware requests that they contact VMware Support to discuss alternative solutions.
- We ordinarily don't recommend polling the API for stats data more frequently than every 10 min. New stats data arrives at the SASE Orchestrator every 5 minutes. Due to jitter in reporting/processing, clients polling every 5 minutes might observe "false-positive" cases where stats aren't reflected in API calls' results. Users tend to find the best result using request intervals of 10 minutes or greater in duration.
- Avoid querying the same information twice.
- Use sleep between APIs.
- For complex software automations, run your scripts and evaluate the CPU/Memory impact. Then adjust as required.
SASE Orchestrator Syslog Configuration
The VMware SASE Orchestrator Syslog capability can be configured independently for the following Orchestrator processes: portal, upload, and backend.
- Portal: The Portal process runs as an internal HTTP server downstream from NGINX. The Portal service handles incoming API requests, either from the SASE Orchestrator web interface or from an HTTP/SDK client, primarily in a synchronous fashion. These requests allow authenticated users to configure, monitor, and manage the various services provided by the SASE Orchestrator.
This log is very useful for AAA activities as it has all actions taken by users in the SASE Orchestrator.
Log files: /var/log/portal/velocloud.log (Logs all info, warn, and error logs)
- Upload: The Upload process runs as an internal HTTP server downstream from NGINX. The Upload service handles incoming requests from SD-WAN Edges and SD-WAN Gateways, either synchronously or asynchronously. These requests primarily consist of activations, heartbeats, flow statistics, link statistics, and routing information sent by SD-WAN Edges and SD-WAN Gateways.
Log files: /var/log/upload/velocloud.log (Logs all info, warn, and error logs)
- Backend: Job runner that primarily runs scheduled or queued jobs. Scheduled jobs consist of cleanup, rollup, or status update activities. Queued jobs consist of processing link and flow statistics.
Log files: /var/log/backend/velocloud.log (Logs all info, warn, and error logs)
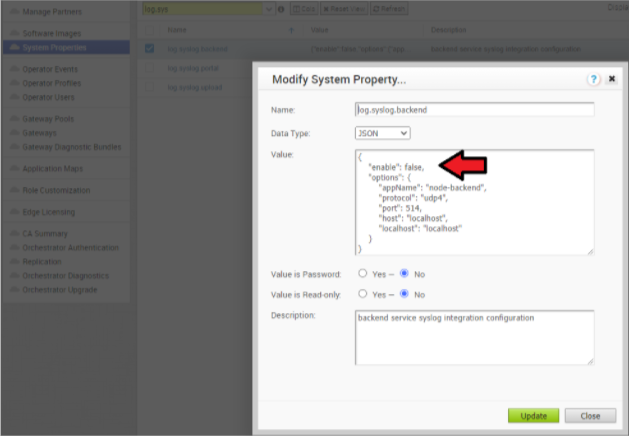
- Navigate to System Properties in the SASE Orchestrator, log.syslog.<server> (eg log.syslog.portal). Go to SASE Orchestrator → System Properties → type “log.syslog” in the search bar
- Change the “enable”:false value to true for one or more of the servers. Change the Host IP and port accordingly to your implementation.
Increasing Storage in the SASE Orchestrator
For detailed instructions to increase the Storage in the SASE Orchestrator, see Install SASE Orchestrator and Expand Disk Size (VMware).
- Best Practices:
- Make sure that the same LVM distribution is applied to the Standby Orchestrator.
- It is not recommended to reduce the size of the volumes once they were increased. Use thin provisioning instead.
- In 3.4, when increasing the disk size, the following percentage/value distribution may be used:
- “/” Volume: This volume is used for the operative system. Production Orchestrators are usually set to 140GBs and have from 40% to 60% usage.
- /store and /Store2: The proportion applied in production Orchestrators is close to 85% for /Store and 15% for /Store2.
- The following guidelines in the table below should be used in the 4.x release and onwards.
Instance Size /store /store2 /store3 /var/log Small (5000 SD-WAN Edges) 2 TB 500 GB 8 TB 100 GB Medium (10000 SD-WAN Edges) 2 TB 500 GB 12 TB 125 GB Large (15000 SD-WAN Edges) 2 TB 500 GB 16 TB 150 GB
Managing Certificates in the SASE Orchestrator
The SASE Orchestrator uses a built-in certificate server to manage the overall PKI lifecycle of all SD-WAN Edges and SD-WAN Controllers. X.509 certificates are issued to the devices in the network.
For detailed instructions to configure the CA, see Install SASE Orchestrator and Install an SSL Certificate.
- Management plane TLS 1.2 tunnels between the SASE Orchestrator and SD-WAN Edge SD-WAN Controller.
- Control and Data plane IKEv2/IPsec tunnels between SD-WAN Edges and between SD-WAN Edgeand SD-WAN Controller.
Certificate Revocation List
vcadmin@vcg1-example:~$ openssl crl -in /etc/vc-public/vco-ca-crl.pem -text | grep 'Serial Number' | wc -l
14
vcadmin@vcg1-example:~
Support Interaction
Our Customer Support organization provides 24x7x365 world-class technical assistance and personalized guidance to VMware SD-WAN customers.
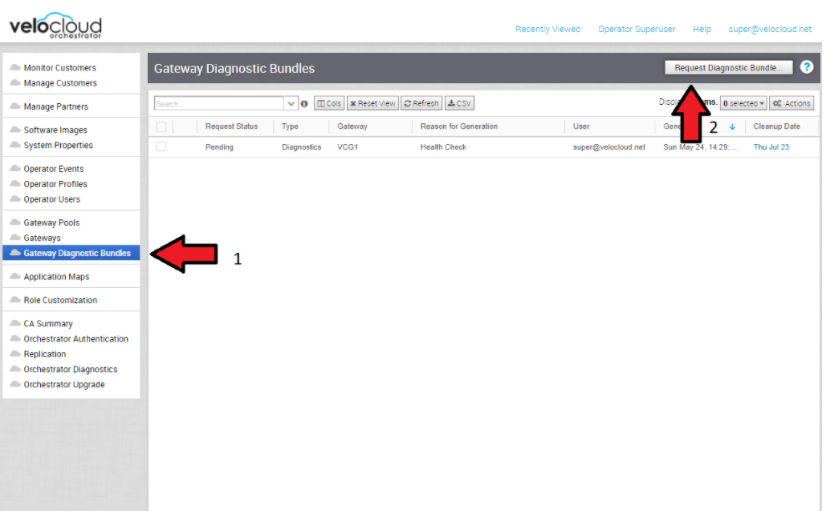
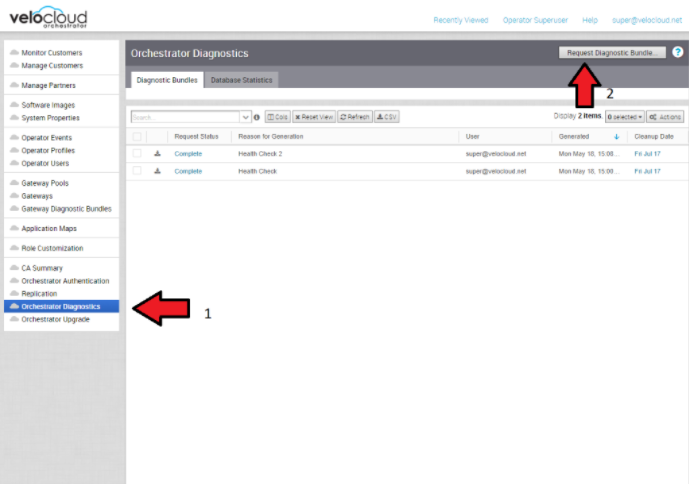
- Diagnostic Bundles
While investigating an incident, a diagnostic bundle of the SASE Orchestrator and SD-WAN Controller can be created. The resulting file will assist the VMware Support team to further analyze the events around an issue.
- Share Access with Support
On occasion assistance from VMware Support representatives for the SASE Orchestrator and SD-WAN Controllers may be required.
Some common ways to grant access are:- Remote sessions with Support: The customer would either grant remote control to the SSH jump server or follow the Support representative's instructions.
- Creating an account for the Support team in the SASE Orchestrator. This helps the Support team gather logs without customer interaction.
- Through the Bastion Host: SSH permissions and keys can be configured to allow the Support engineers to access the on-premises SASE Orchestrator and SD-WAN Controller using a Bastion Host.
When contacting VMware SD-WAN Support to assist triaging an issue, include the data described in the table below.
More information can be found in the following link: https://knowledge.broadcom.com/external/article?legacyId=53907
| Required | Suggested |
|---|---|
| Partner Case Number | Issue Start/Stop |
| Partner Return Email/Phone | Impacted Flow SRC/DST IP |
| SASE Orchestrator URL | Impacted Flow SRC/DST Port |
| Customer Name in SASE Orchestrator | Flow Path (E2E, E2GW, Direct) |
| Customer Impact (High/Med/Low) | SD-WAN Gateway Name(s) |
| SD-WAN Edge Name(s) | Link to PCAP in the SASE Orchestrator |
| Link to Diagnostic Bundle in SASE Orchestrator | |
| Short Problem Statement | |
| Analysis & Requested Assistance |
