


As an Operator user, you can monitor the status of your Customers along with the Edges connected to the Customers.
Log into the VMware SASE Orchestrator as an Operator user. In the SD-WAN service of the Operator portal, click .
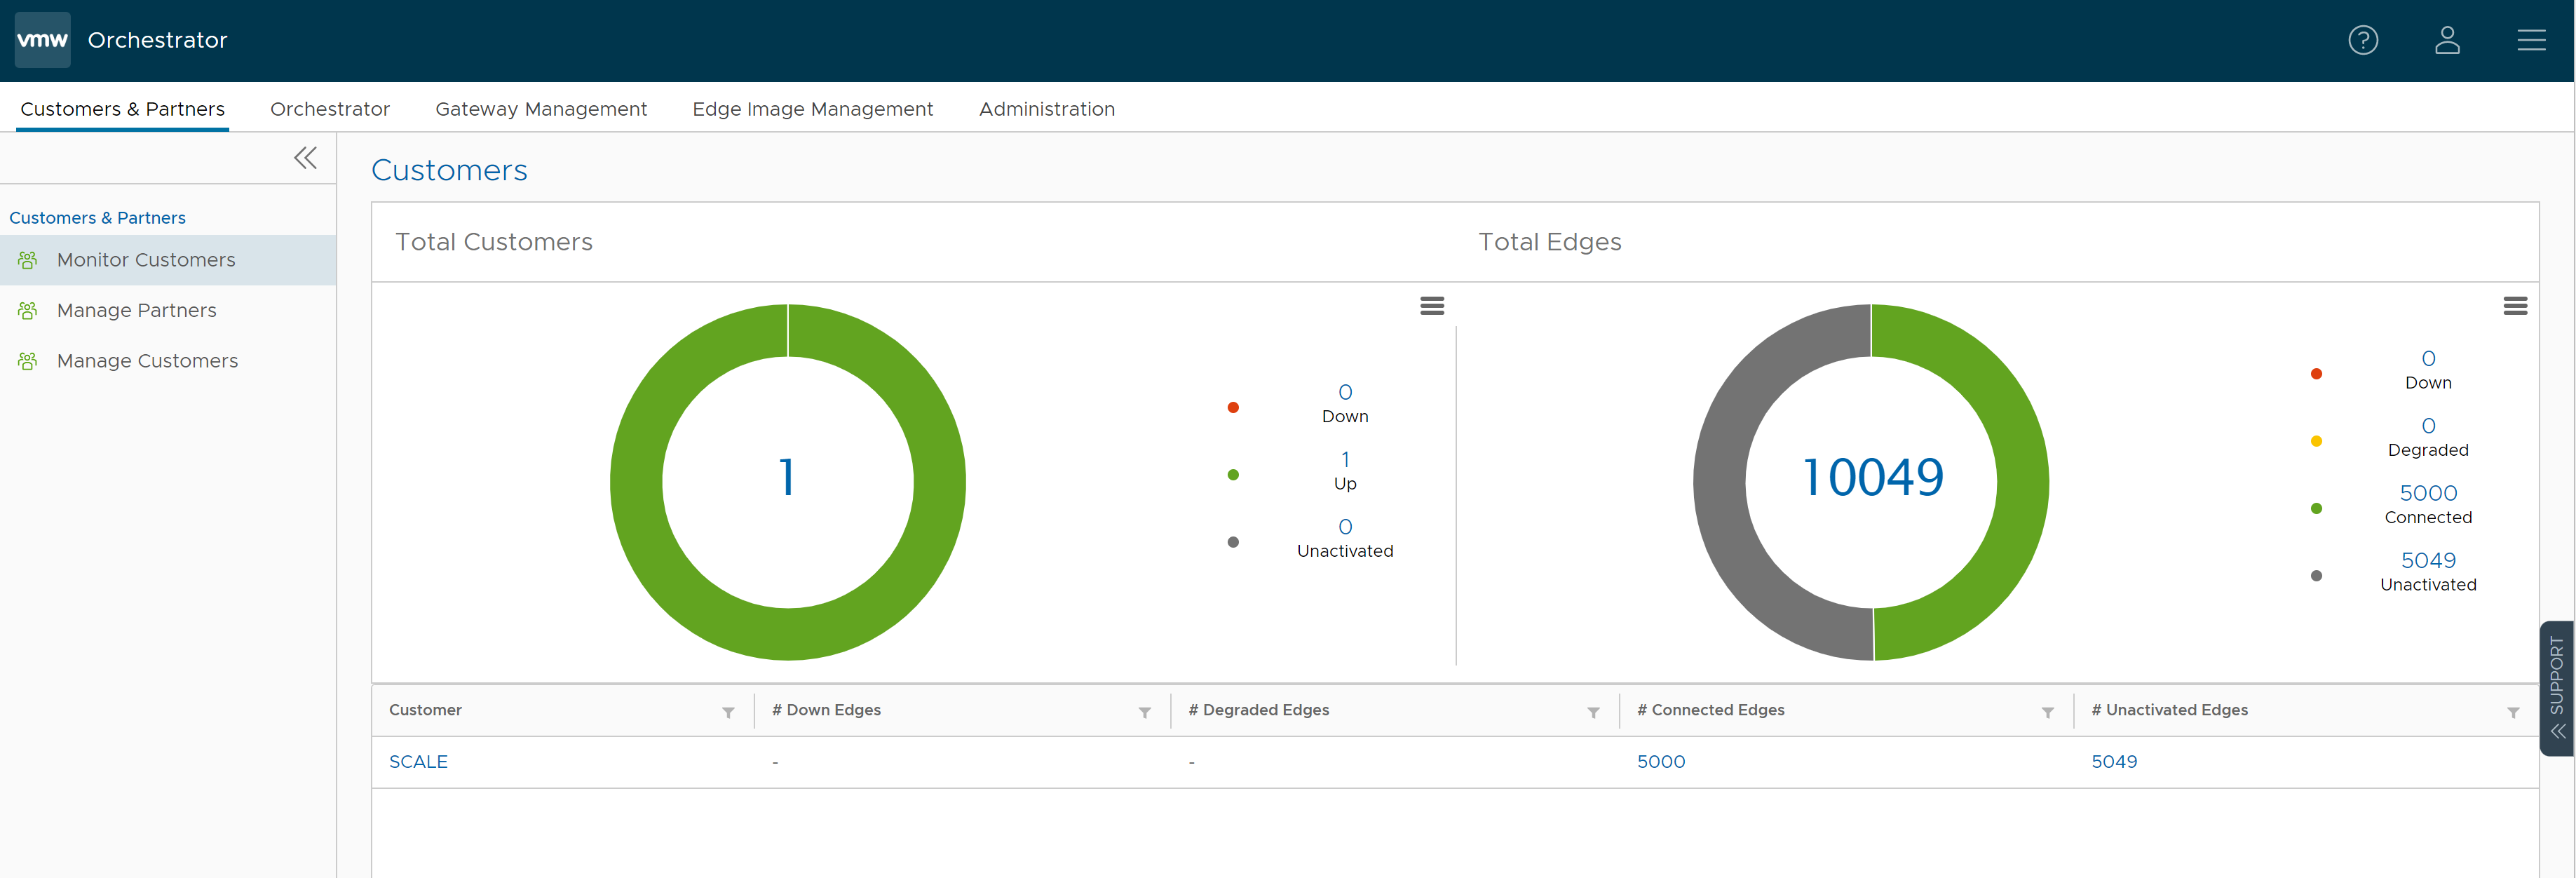
The Customers page displays the following details:
Total Customers
- Customers managed by the Operator.
- Number of Customers that are UP, DOWN, and UNACTIVATED. Click the number to view the corresponding Customer details at the bottom panel.
- In the bottom panel, click the link to the Customer name to navigate to the Enterprise portal, where you can view and configure other settings corresponding to the selected customer. For more information see the VMware SD-WAN Administration Guide published at https://docs.vmware.com/en/VMware-SD-WAN/index.html.
Total Edges
- Edges associated with the Customers.
- Number of Edges that are DOWN, DEGRADED, CONNECTED, and UNACTIVATED. Click the number to view the corresponding details of the Edges in the bottom panel.
- In the bottom panel, place the mouse cursor on the Down Arrow displayed next to the number of Edges, to view the details of each Edge. Click the link to the Edge name to navigate to the Enterprise Monitoring portal, where you can view more details corresponding to the selected Edge. For more information see the VMware SD-WAN Administration Guide published at https://docs.vmware.com/en/VMware-SD-WAN/index.html.
Note: The Orchestrator UI does not provide the option for Auto Refresh. You can refresh the window manually to view the current data.
