Telegraf is a plugin-driven server agent for collecting and sending metrics and events from systems.
The Input plugin is /etc/telegraf/vcg_metrics.py, a file that contains the counters to be added. The Output plugin can be either Wavefront or Prometheus.
Telegraf collects the metrics from the declared Inputs and sends the details to the declared Outputs.
Note: Whenever there is a change in Telegraf configuration, you need to restart the Telegraf process using the command
systemctl restart telegraf.
Procedure
- Use the following commands to configure the Output plugin. You can customize the ports in the corresponding configuration files as required.
- For Wavefront
[[outputs.wavefront]]
host = "wavefront_proxy_IP"
port = 2878
metric_separator = "."
source_override = ["hostname", "agent_host", "node_host"]
convert_paths = true
The parameter wavefront_proxy_IP is the IP address of the Wavefront proxy server.
- For Prometheus
[[outputs.prometheus_client]]
listen=":9273"
metric_version=2
- Telegraf needs to run the
/opt/vc/bin/dispcnt command in vcg_metrics.sh to collect the metrics from Gateway, and the command requires sudo. Use the following command to add Telegraf to the sudo group.
sudo usermod -G sudo telegraf
- Add IP table rules to allow the external monitoring systems to get access to Telegraf port. The source IP address should be specified for security reasons. Add the following rules to allow traffic from wavefront and Prometheus. If required, you can customize the ports in the corresponding configuration files.
Note: As IP table rules are not persistent across reboots, it is recommended to save the IP table rules using the command
iptables-save. This command saves the rules automatically. You can also store the rules manually in a user-specific file and reuse the rules later.
- For Wavefront
sudo iptables -I INPUT -p tcp -m tcp --source <wavefront_proxy_IP> --sport 2878 -m comment --comment "wavefront" -j ACCEPT
- For Prometheus
sudo iptables -I INPUT -p tcp -m tcp --source <IP> --dport 9273 -m comment --comment "prometheus" -j ACCEPT
Results
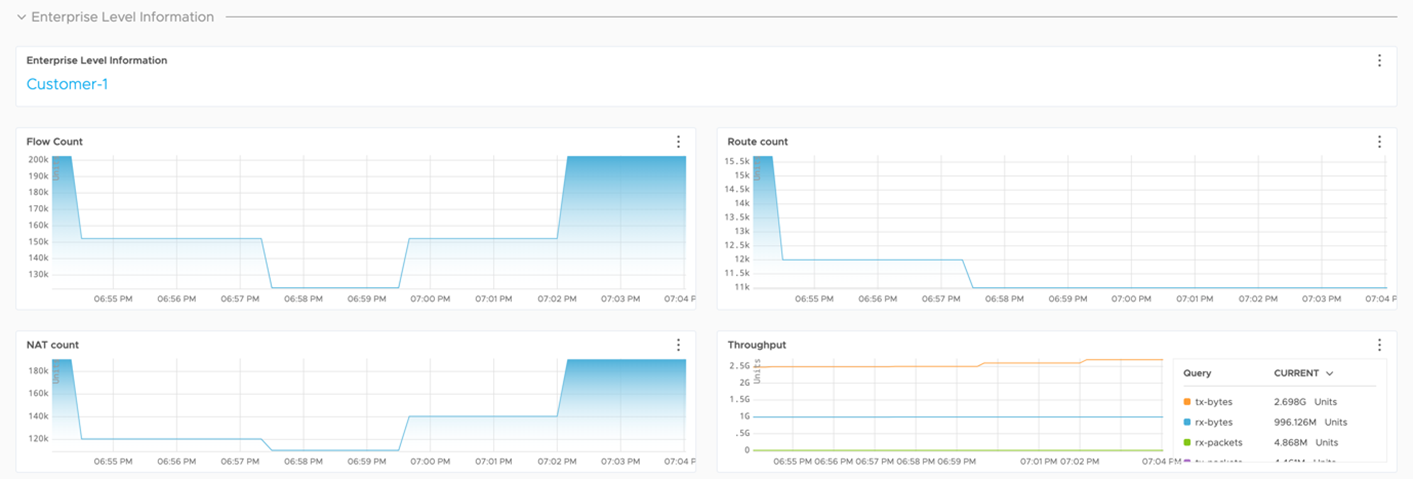
The integration of Telegraf sends the data from the Gateways to the output plugins and you can view the details in the dashboards in visual format.
The following image shows an example output displayed in wavefront dashboard. The Graph illustrates Enterprise level information of flow count, NAT count, route count, and throughput details.
For the list of the counters that are exported by the input plugin script /etc/telegraf/vcg_metrics.py, see Supported Counters.


