


This section explains how to integrate VMware SD-WAN Edges with IBM QRadar SIEM. It includes instructions on how to configure IBM QRadar Event Collectors as IPFIX and Syslog service endpoints. This section also covers how to set up QRadar Flow Collectors as IPFIX Collectors in the VMware SASE Orchestrator, set up NetFlow in Edge Profiles, add the QRadar Event Collectors as Syslog Servers, turn on Syslog Forwarding for Edge Firewall and Enhanced Firewall Services, and create a Firewall Rule.
How to Integrate VMware SD-WAN Edges with IBM QRadar
You have prepared IBM QRadar to receive data from the SD-WAN Edge appliances. Now, you need to configure the IBM QRadar Event Collectors as IPFIX and Syslog service endpoints.
Remember, IBM QRadar uses "Regular" network interfaces to collect log and flow data. If you are not sure what the interface IP address is, please follow these steps:
- Go to .
- In the Display field, select Systems.
- Select the Event Collector that you want to use as a target system.
- Open the Actions drop-down menu from the top menu bar.
- Select View and Manage System.
- Select the Network Interfaces tab in the new window.
You will see a similar output for your node:

Now, you can switch from IBM QRadar to the VMware Edge Cloud Orchestrator. We will perform the following steps in the VMware SASE Orchestrator:
- On the Enterprise level, define the IBM QRadar Flow Collectors as NetFlow/IPFIX Collectors.
- On the Edge or Edge Profile level, enable the Edges to start the flow export process and send telemetry to the Flow Collectors defined in the previous step.
- While on the Edge or Edge Profile level, configure Event Collectors as Syslog servers.
- Enable the Edge Firewall or Enhanced Firewall Services logging.
- Define a Firewall Rule with logging enabled.
1. How to Set Up QRadar Flow Collectors as IPFIX Collectors in the VMware Edge Cloud Orchestrator
The IBM QRadar system can receive IPFIX updates by default on UDP port 2055. You need to define the system as a Flow Collector. You can do this at the enterprise (customer) level first. Follow these steps:
- Go to in the VMware Edge Cloud Orchestrator.
- Click + New.
- Fill out the settings as shown below:
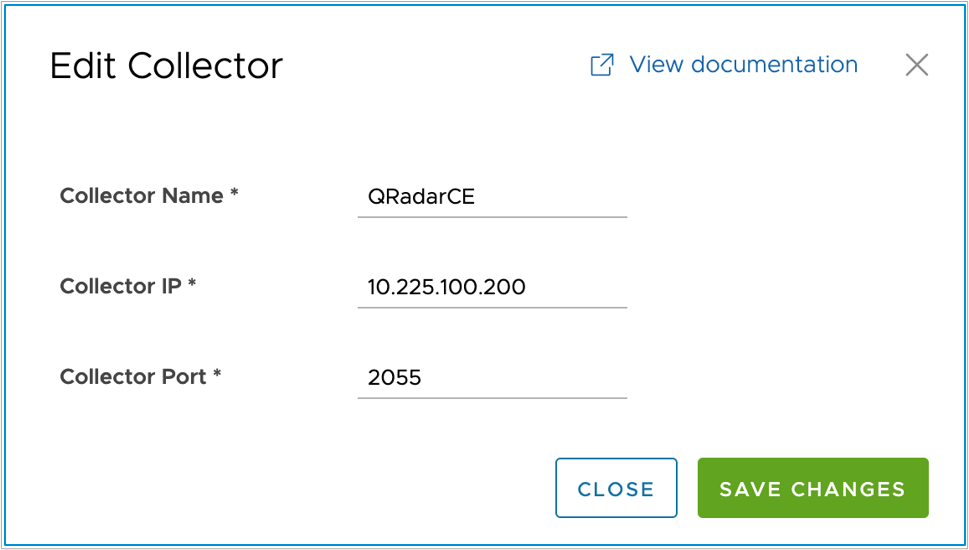
| Flow Collector Settings | |
|---|---|
| Collector Name | An administrative name of the collector that provides identification. |
| Collector IP | The destination IPv4 address that flow data will be sent. In case of IBM QRadar, this will be the Regular NIC of the Flow Collector system. |
| Collector Port | The UDP port on which the Collector is listening for inbound flow data from network devices. In case of IBM QRadar, this is UDP port 2055. |
If you use multiple QRadar Event Collectors for your VMware SD-WAN fabric, ensure they are all added.
Once all the collectors are defined, you can create filters to reduce the number of flows sent by defining filters. To do this, click +New under Filters in the main Orchestrator screen:
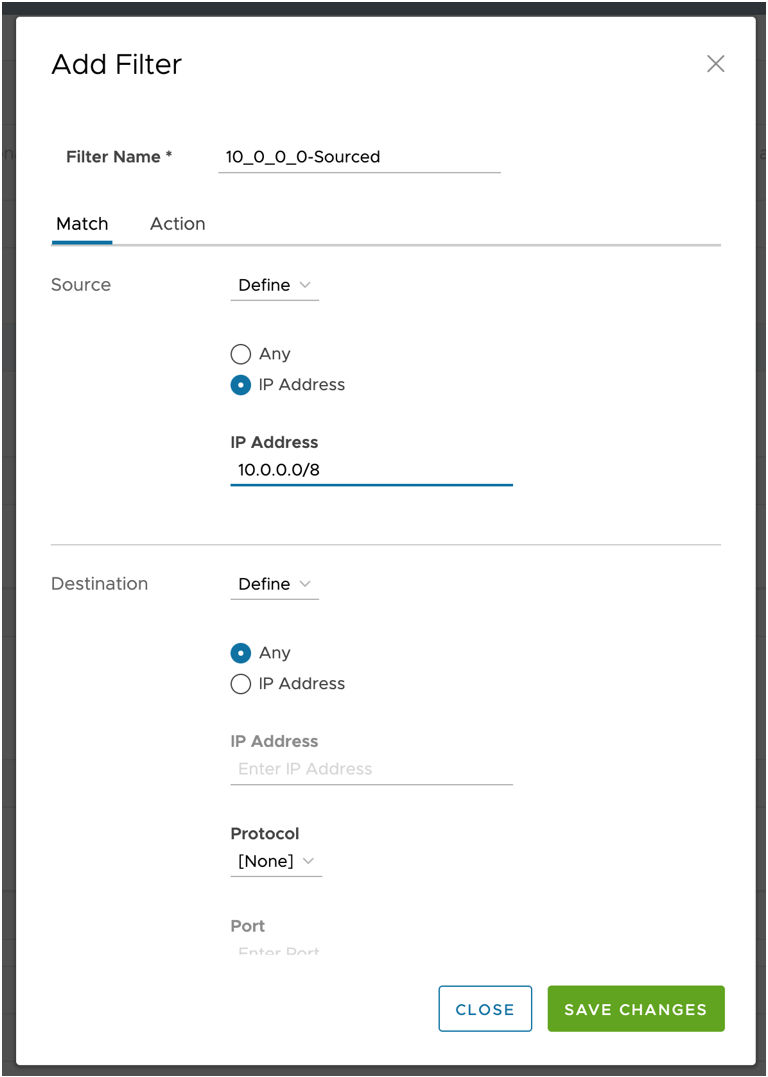
Filters work as match/set statements, you can select traffic sources in the Match tab, Destinations and even Applications (data derived from Deep Application Recognition or DAR), and based on the defined criteria, flow records can get exported to flow collectors or filtered. This is a helpful mechanism to save Flows per Minute (FPM), which helps you to spend your IBM QRadar Flow licenses in the most optimal way.
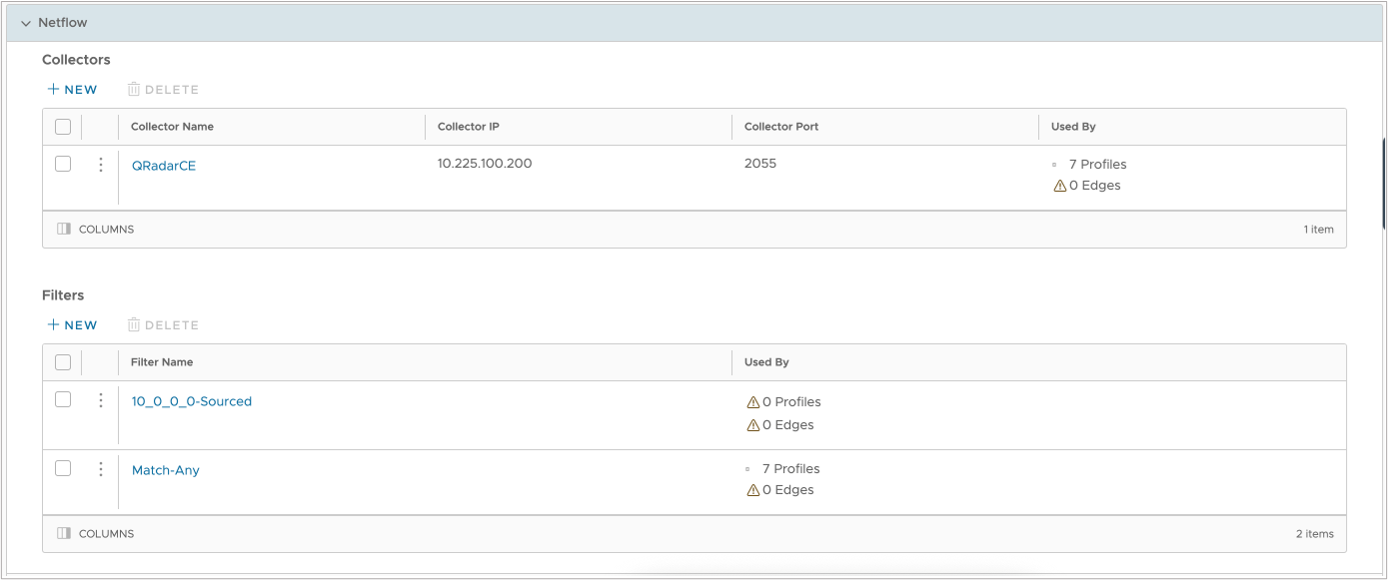
When everything is set, please ensure that all settings are correct in the Network Services configuration screen:
While the IPFIX settings must be pre-defined on an enterprise level, Syslog settings can be applied without any previous definition (as of Release 5.2.0.x). In the next step, we will define the IBM QRadar event collectors as Syslog targets and apply the IPFIX settings we created.
2. Set up NetFlow in Edge Profiles
You need to use one or more profiles to build your VMware SD-WAN fabric. Profiles are like templates that help you apply common settings to many devices in your network.
First, you need to find the profiles that you want to use for your deployment. You also need to set IBM QRadar as a Flow Collector for each profile. To do this, go to and click the profile you want to change. Then go to the Device tab and click on Telemetry. Then check the box for Activate NetFlow:

| Flow Collector Settings – Edge Profile View | |
|---|---|
| Collector | Select the collector that is the designated event collector for Edges using this profile. |
| Collector IP Address (Read-Only) | The destination IPv4 address that flow data will be sent. In the case of IBM QRadar, this will be the Regular NIC of the Flow Collector system. |
| Collector Port (Read-Only) | The UDP port on which the Collector is listening for inbound flow data from network devices. In case of IBM QRadar, this is UDP port 2055. |
| Filter | Select a pre-configured filter to ensure that only relevant flows will be exported to the Flow collector. |
| Allow All | If you are using a multi-segment (Multi-VRF) SD-WAN deployment, and you need to collect flows from traffic in other segments, check this option. |
| Version | VMware SD-WAN only supports IPFIX (NetFlow Version 10) data export. |
| Intervals (Multi-line) | If you need to fine-tune the flow export operations, you can change the flow timers here. This configuration is only available if the Global Segment is selected in the segment selection drop-down box at the top. |
After you make the changes, click on Save Changes, and wait for them to take effect. You can see the progress of the changes from the Events view.
3. Add the QRadar Event Collectors as Syslog Servers
IBM QRadar Event Collectors can receive Syslog data from Log Sources on UDP and TCP ports 514. To make sure that the Edges send log events to IBM QRadar, not just Flow data, you should make most changes at the profile level. This will make sure that all Edges in your VMware SD-WAN fabric have the same security configuration and can scale out easily. You need to find all the Edge Profiles that you want to use for your deployment first.
To set up Syslog services, go to , then choose the profile(s) you want to change, and then go to the Device tab and click on Telemetry. Under the Syslog section, check the box for Enable Syslog.
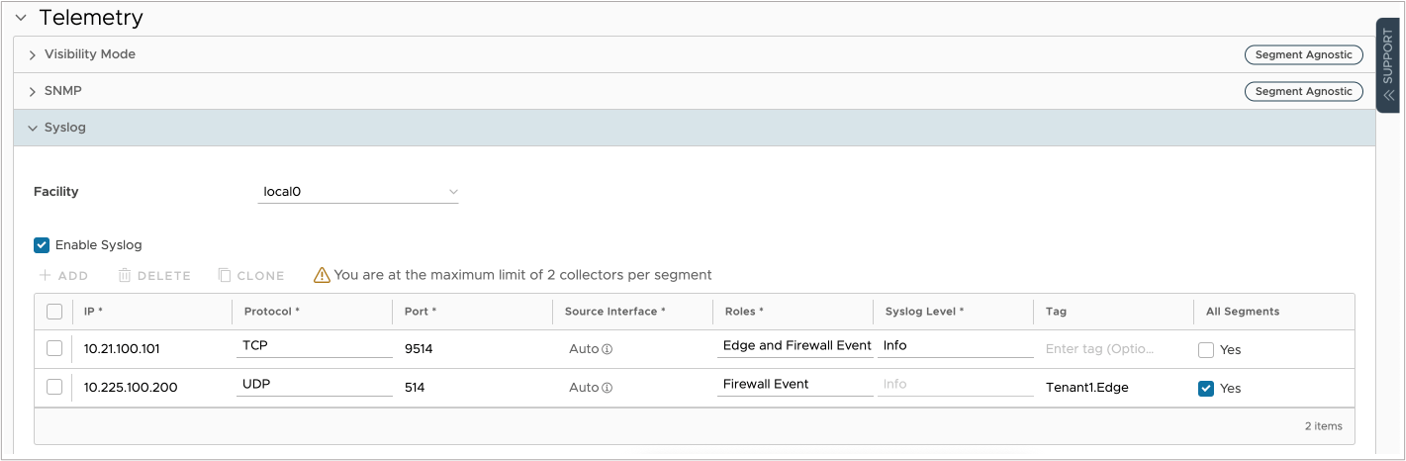
| Syslog Settings – Edge Profile View | |
|---|---|
| IP | Type in the IP address of the IBM QRadar Event collector managing the edges associated with this profile. This is typically the same Event collector node that the Edge is using as a Flow Collector. |
| Protocol | The SD-WAN Edge supports both UDP and TCP protocols. Based on your IBM QRadar deployment and network connectivity, you might prefer one or the other. |
| Port | By default, the IBM QRadar Event Collectors listen to Syslog under port 514 (both TCP and UDP). |
| Roles | This setting supports Edge Events, Firewall Events and Edge and Firewall Events. In case of IBM QRadar, both is supported in the DSM. In case you want to retrieve Edge Events (Interface status changes, Management and Control Plane updates, and so forth) using the Orchestrator API, you can select Firewall Events only. |
| Syslog Level | Based on the Level selected here, events classified on this level (or higher) will be sent to the Syslog server. If Firewall Events is set under Roles, this field will default to Info, as Firewall events are set as Informational messages. |
| Tag | Each Syslog message can be appended with a custom tag in the header. Some systems can identify tenants and other service details from this tag. In IBM QRadar, this tag has no relevance. |
| All Segments | If you have a multi-segment (Multi-VRF) SD-WAN fabric, and need to export firewall events from all segments, you should select this box. |
Make sure you Save Changes to complete your configuration.
4. Turn on Syslog Forwarding for Edge Firewall and Enhanced Firewall Services
Now you can send Edge events (like configuration changes, interface changes, and so on) to IBM QRadar, but you also need to send firewall events. You can do this on the Profile or Edge level. Usually, it is better to do this on the profile level to make sure it works for all devices in your network. But sometimes, you may have different firewall rules for each Edge, so in this guide, we will show you how to do it on the Edge level.
To start, go to and choose the Edge that you want to change. Then click on the Firewall tab.
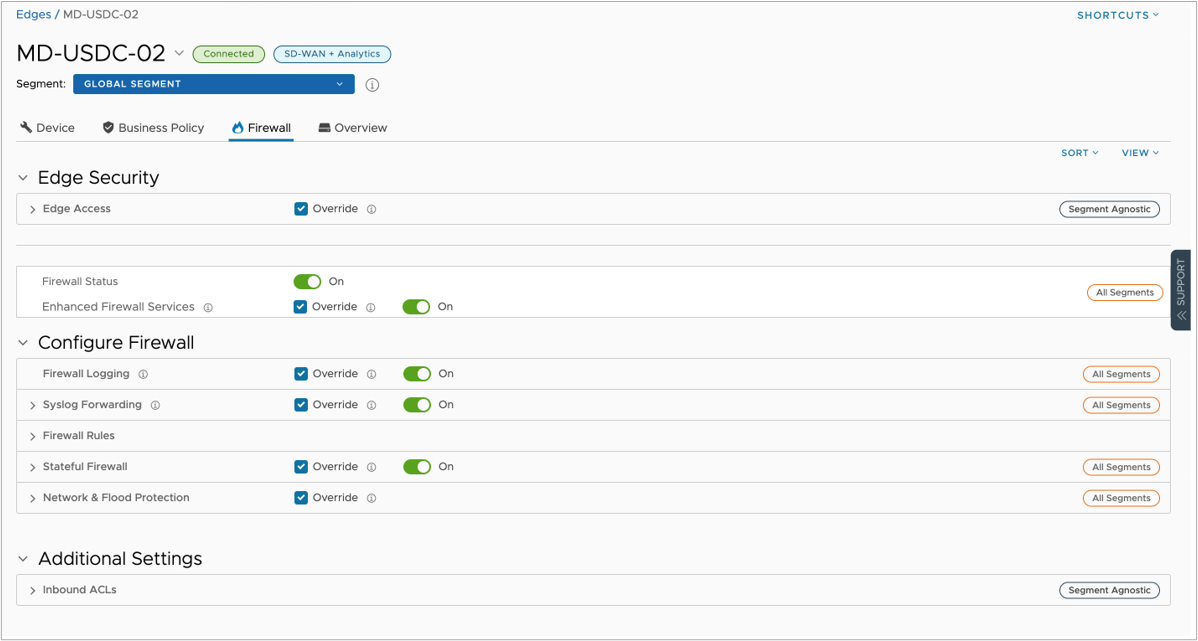
On the Firewall tab, make sure that these settings are turned on:
- Firewall Status
- Enhanced Firewall Services (if you need IDS/IPS service)
- Firewall Logging (if you want to send a copy of the log events to the hosted logging service)
- Syslog Forwarding
- Stateful Firewall
- Network and Flood Protection (if you want to protect the Control/Management Plane)
The Firewall Logging and Syslog Forwarding settings control the event logging for the Edge Firewall services. Under the Syslog Forwarding section, you can see the Syslog server settings that come from your profile and Edge override configurations.
5. Make a Firewall Rule with Logging Turned On
The last step is to make a Firewall Rule with Logging turned on for the Edge. This will make sure that events are sent to IBM QRadar. You can add or change rules under the Firewall Rules section.
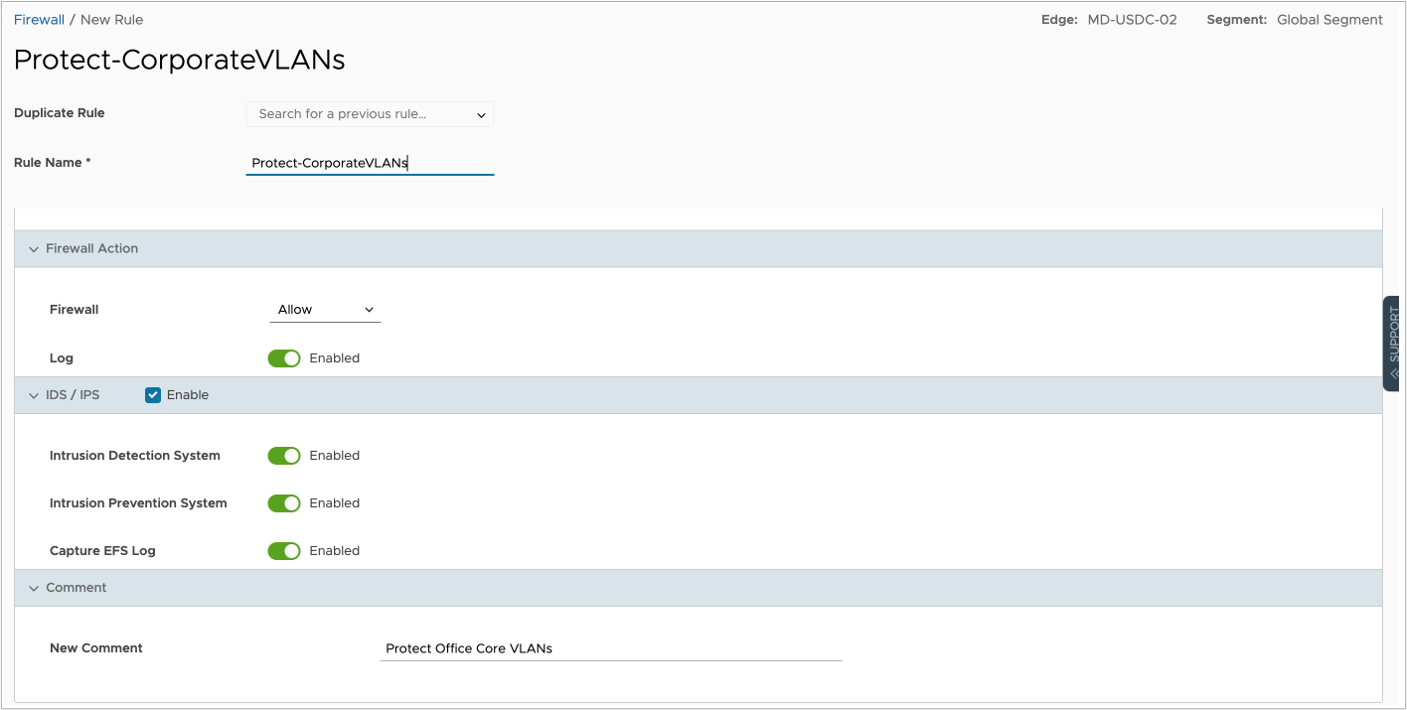
Make sure the listed fields are enabled for Firewall events to be sent to the IBM QRadar system:
| Firewall Rule – Logging Settings per Rule | |
|---|---|
| If this field is enabled, the Edge will generate a log event (locally and to the Syslog server) whenever a flow matches the firewall rule. This is useful for troubleshooting and monitoring purposes. | |
| IDS/IPS | If further inspection is necessary to determine whether a flow is malicious, the IDS/IPS system must be enabled. In this case, the Intrusion Detection System must be in the Enabled state for an IDS event to be generated. |
| When this field is enabled, the Edge will generate an event. Both a local message and a Syslog message, enriched with the IDS/IPS event, will be recorded. This field is only required if the IDS/IPS service is enabled for the rule. | |
