


This section provides troubleshooting steps for an IBM QRadar SIEM and VMware SASE deployment, including how to fix Log Source errors when no events are received, check that Syslog packets are coming from the correct interface on the SD-WAN Edge, override the Source Interface Selection in the Orchestrator, and verify that messages are being received by the IBM QRadar Event Collector.
How to fix Log Source errors when no events are received for more than 720 minutes
Sometimes, VMware SD-WAN Edges may not send events to the QRadar Event Collector for a long time. This can depend on your Firewall policy, flow characteristics and log settings. If this happens, some Edge appliances may show an error in the Log Source Management App:
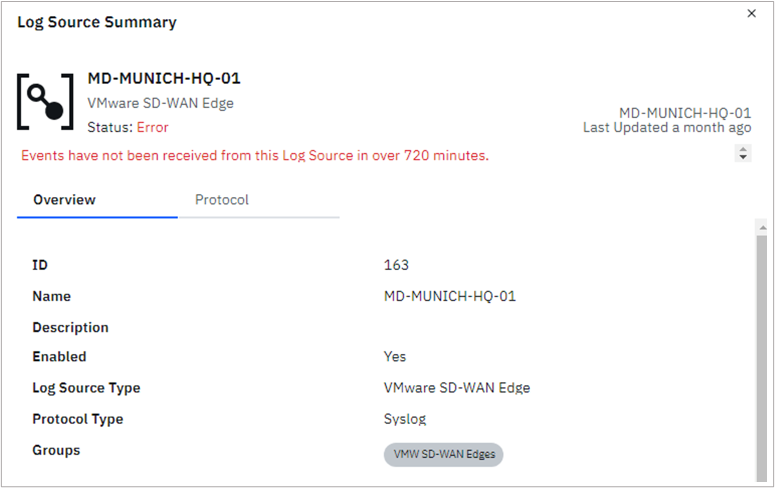
To fix this, you may need to change a system-wide setting called Syslog Event Timeout parameter. You can find out how to do this in this KB article.
Check that Syslog packets come from the right interface on the SD-WAN Edge
In production environments, you may have one or more firewalls that filter traffic between your SD-WAN Fabric and the IBM QRadar Event Collector nodes. An Edge may have many interfaces that can send syslog messages, so you need to make sure that the configuration is right on both the Edges and the firewalls that protect the Event Collector. You can check the source interface for each service on the VMware Edge Cloud Orchestrator. To do this, go to the Edge appliance using , then choose the Edge you want to check, and after the connection is made, click on the Source Interface Dump diagnostic:
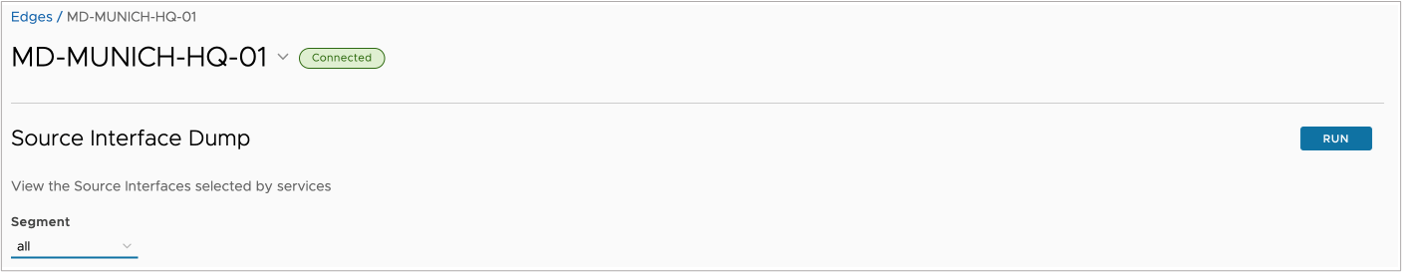
After clicking Run, you get a list of the services that the Edge is configured to support:

This widget lets you see all the configurations that the Edge got from the Orchestrator. For the IBM QRadar SIEM integration, you should look for two types of service. Please make sure that these are correct:
| Source Interface Output | |
|---|---|
| Service | This should be either RSYSLOG or NetFlow. |
| Source Interface | This field represents the source interface from which the events or flows will be sent from. |
| Source Selection | By default, the Edges allocate source interfaces automatically. This behavior can be overridden, and a source interface (such as a Loopback interface) can be set manually. |
| Source IP | This field specifies the IPv4 or IPv6 address from which messages will originate. |
| Destination IP | This field specifies the IPv4 or IPv6 address to which flows or events will be sent. In the case of IBM QRadar, this may be the same destination or separate systems in a distributed setup. |
| Destination Port | This field represents the port number on the destination system that packets will be sent to. In the case of IBM QRadar default settings, 2055 should be used for the IPFIX protocol and 514 for RSYSLOG. |
| Destination Route | The VMware SD-WAN Edge performs a route lookup for the destination IP address. The system will then display the prefix and next hop information. The Event and Flow collector can be placed in subnets connected to the Edge LAN interfaces (either directly routed, or connected using static routing, OSPF or BGP), in the Underlay (for example, if you are using MPLS as a transit), or in the Underlay (accessible via Gateways or a designated Hub location), depending on the SD-WAN fabric design. |
Override the Source Interface Selection in the Orchestrator
The VMware SD-WAN Edges automatically choose the source interfaces for traffic that they generate (based on their routing information and interface layout). Like any network appliance, physical interfaces can change states, and even if there is another path to the collector nodes, the source IP address may change. To make sure that Management traffic always comes from the same IP address and the interface stays up no matter what happens to the physical network, it is best to use Loopback interfaces for this type of traffic.
To change the default, automatic interface assignment, you can go to , choose the Edge that you want to change, then on the Device tab, go to and open the Management Traffic section, and select the interface you want from the Source Interface dropdown menu:
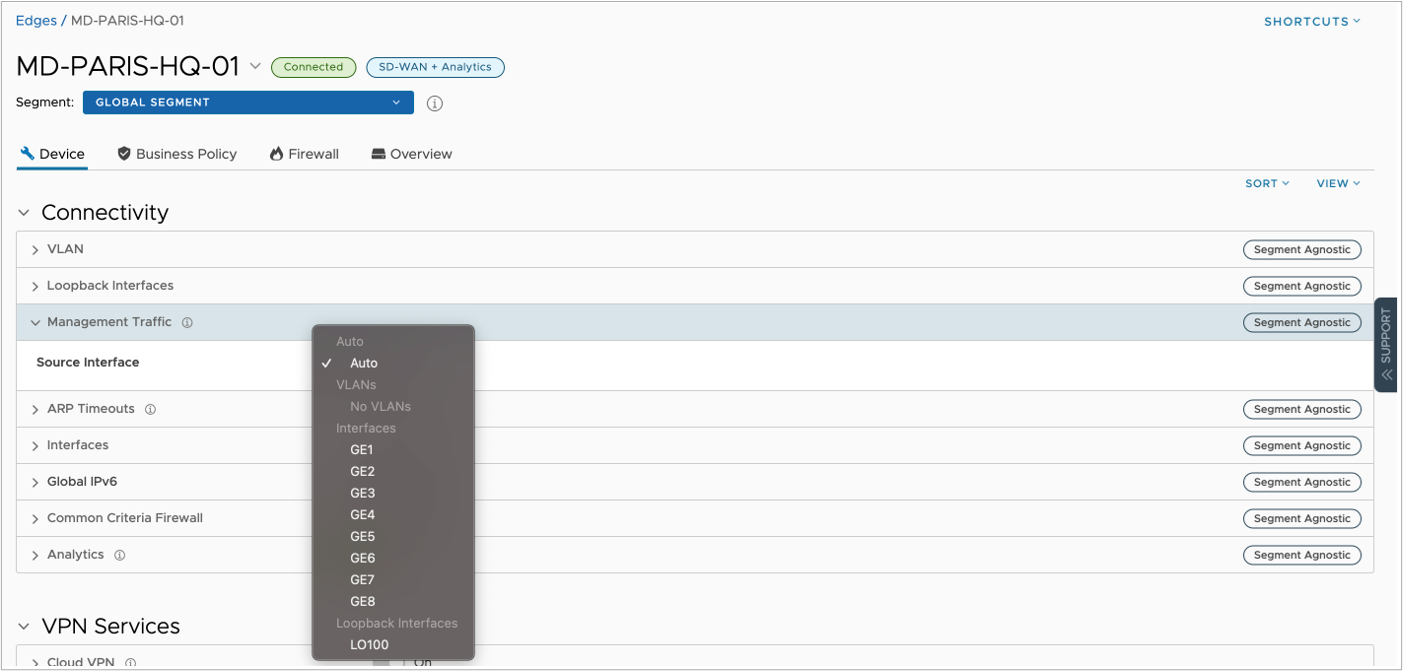
Please note that this change will affect all services that are classified as management traffic.
See if messages are coming in on the IBM QRadar Event Collector
Now that we have made sure that communication between the SD-WAN Edges and the Event or Flow Collector nodes is using the right path and source and destination IP addresses, we can check if the Collectors are getting Syslog and IPFIX messages. A quick way to check is to run a packet capture on the collector interface.
For this, you need SSH access to the Collector node you are troubleshooting. After logging in to the system, you can check the IP addresses and interface layout with a simple “ip address” or “ip a” command.
[root@qradar1 ~]# ip address
<output omitted>
2: ens33: <BROADCAST,MULTICAST,PROMISC,UP,LOWER_UP> mtu 1500 qdisc prio state UP group default qlen 1000
    link/ether 00:50:56:94:90:ab brd ff:ff:ff:ff:ff:ff
    inet 10.225.100.200/24 brd 10.225.100.255 scope global ens33
       valid_lft forever preferred_lft forever
    inet6 fe80::250:56ff:fe94:90ab/64 scope link
       valid_lft forever preferred_lft forever
3: ens160: <BROADCAST,MULTICAST,UP,LOWER_UP> mtu 1500 qdisc prio state UP group default qlen 1000
    link/ether 00:50:56:94:d1:c4 brd ff:ff:ff:ff:ff:ff
    inet 10.225.0.200/24 brd 10.225.0.255 scope global ens160
       valid_lft forever preferred_lft forever
    inet6 fe80::250:56ff:fe94:d1c4/64 scope link
       valid_lft forever preferred_lft forever
<output omitted>
You can also see the interface name and role assignment in the IBM QRadar Console. After you confirm which interface is set up for event or flow collection, you can use the “tcpdump” command to start a packet capture. Here is an example of this command and its parameters:
sudo tcpdump -i <interface name> -s0 -vv -nn src <log source IP address> and dst port <514 or 2055>
# sudo tcpdump -i ens33 -s0 -vv -nn src 10.99.211.1 and dst port 514
tcpdump: listening on ens33, link-type EN10MB (Ethernet), capture size 262144 bytes
14:29:26.751712 IP (tos 0x0, ttl 61, id 54724, offset 0, flags [none], proto UDP (17), length 243)
    10.99.211.1.50142 > 10.225.100.200.514: [udp sum ok] SYSLOG, length: 215
        Facility local0 (16), Severity info (6)
        Msg: Aug 14 14:29:30 MD-MUNICH-HQ-01 VMW.Edge: ACTION=VCF Drop SEGMENT=0 PROTO=IPv6-ICMP SRC=fe80::ffff:ffff:ffff:ffff DST=ff02::1 REASON=IPv6: Reverse path forwarding check fail SEGMENT_NAME=Global Segment COUNT=89
<output omitted>
We have verified that the Collector node is getting raw Syslog and IPFIX data at this point. If you need more troubleshooting, please see this. KB Article.
