Learn how to use the mysql-diag tool in VMware Tanzu SQL with MySQL for VMs. mysql-diag prints the state of your MySQL highly available (HA) cluster and suggests solutions if your node fails. VMware recommends running this tool against your HA cluster before all deployments.
mysql-diag checks the following information about the status of your HA cluster:
- Membership status of all nodes
- Size as it appears to all nodes
- If it needs to be bootstrapped
- If replication is working
- Used disk space and inodes per server
Run mysql-diag using the BOSH CLI
To use the BOSH CLI to run mysql-diag, do the following:
-
Obtain the information needed to use the BOSH CLI by doing the procedure in Gather Credential and IP Address Information.
-
SSH into your Tanzu Operations Manager VM by doing the procedure in Log in to the Tanzu Operations Manager VM with SSH for your IaaS.
-
Log in to your BOSH Director by doing the procedure in Authenticate with the BOSH Director VM.
-
Identify the VM to log in to with SSH by running the following command:
bosh -e MY-ENV -d MY-DEPLOYMENT vmsWhere:
MY-ENVis the name of your environment.MY-DEPLOYMENTis the name of your deployment.
-
Record the GUID associated with the
mysql-monitorVM, also known as the jumpbox VM. -
SSH into your
mysql-monitorVM by running the following command:bosh -e MY-ENV -d MY-DEP ssh mysql-monitor/GUIDWhere:
MY-ENVis the name of your environment.MY-DEPLOYMENTis the name of your deployment.GUIDis the GUID you recorded in the previous step.
-
View the status of your HA cluster by running the following command:
mysql-diag
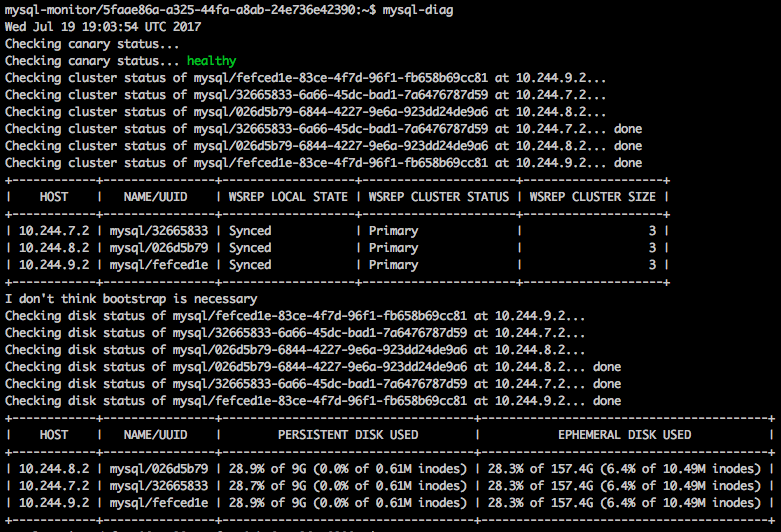
Example healthy output
The mysql-diag command returns the following message if your canary status is healthy:
Checking canary status...healthy
Example mysql-diag output when the tool identifies a healthy HA cluster includes:
- The date
- The canary status, which shows as healthy
- The cluster status of the three service instances
- A table with the headings Host, Name/UUID, WSREP Local State, WSREP Cluster Status, and WSREP Cluster Size. The rows contain:
- the value for WSREP Local State (‘Synced’)
- the value for WSREP Cluster Status (‘Primary’)
- the value for WSREP Cluster Size (‘3’)
- The disk status of the six services instances
- A table with the headings host, name/UUID, persistent disk used, and ephemeral disk used
View a larger version of this image.
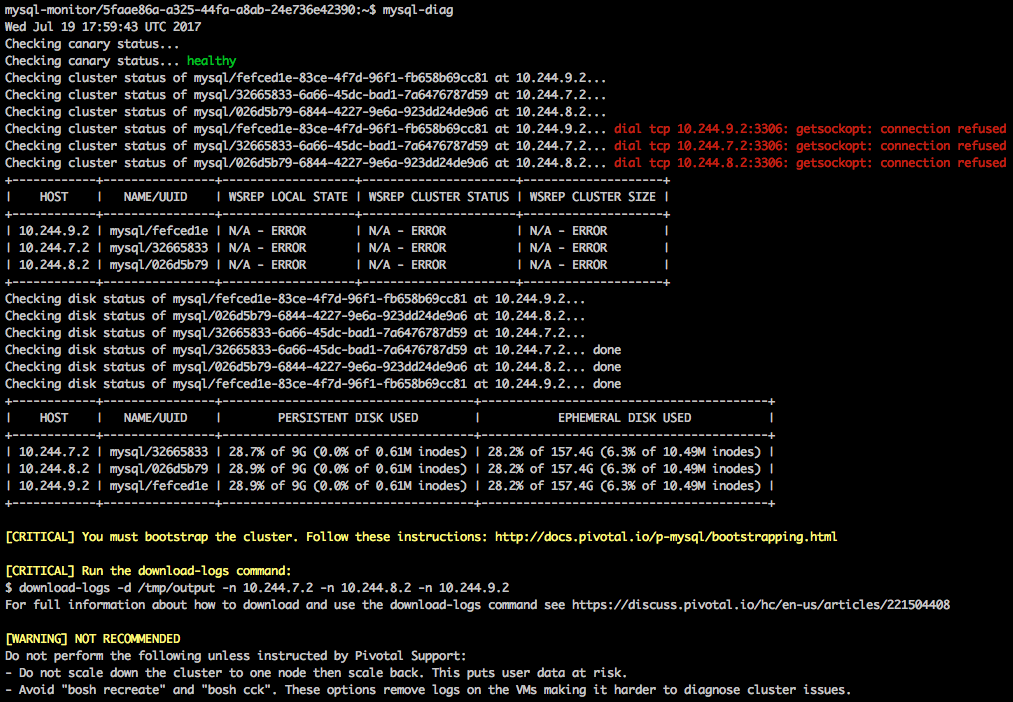
Example unhealthy output
The mysql-diag command returns the following message if your canary status is unhealthy:
Checking canary status...unhealthy
In the event of a broken HA cluster, running mysql-diag outputs actionable steps meant to expedite the recovery of that HA cluster. The sample mysql-diag output after the tool identifies an unhealthy HA cluster is similar to the output described for the healthy case except that some of the clusters show getsockopt: connection refused errors. The output ends with messages marked as Critical containing instructions for what to do and what not do to resolve the issues.