


TYou can obtain the health status for each node in a MySQL database cluster node in a Highly Available (HA) cluster plan.
If you cannot write or connect to your app, you should check the health status of your nodes. You can observe the health status of nodes through a proxy using the Switchboard dashboard or API endpoint. You can also view the number of client connections routed through a proxy to each node. For more information about proxies, see About highly available clusters.
Monitor node health
You can monitor the health status of your nodes by doing one of the following:
Prerequisite
To connect to Switchboard, you must obtain credentials.
To obtain credentials for accessing the Switchboard dashboard and API, do the following:
-
Run the following command:
cf service YOUR-HAWhere
YOUR-HAis the name of your HA cluster.$ cf service myHA Showing info of service myHA in org acceptance / space example as admin... name: myHA service: p.mysql tags: plan: db-ha-small description: Dedicated instances of MySQL documentation: dashboard: proxy.YOUR-SYSTEM-DOMAIN.TLD (username: 'PROXY-API-USERNAME', password: 'PROXY-API-PASSWORD') Showing status of last operation from service myHA... status: update succeeded message: Instance update completed started: 2018-11-20T01:25:55Z updated: 2018-11-20T01:30:33Z
-
Record the dashboard hostname, user name, and password.
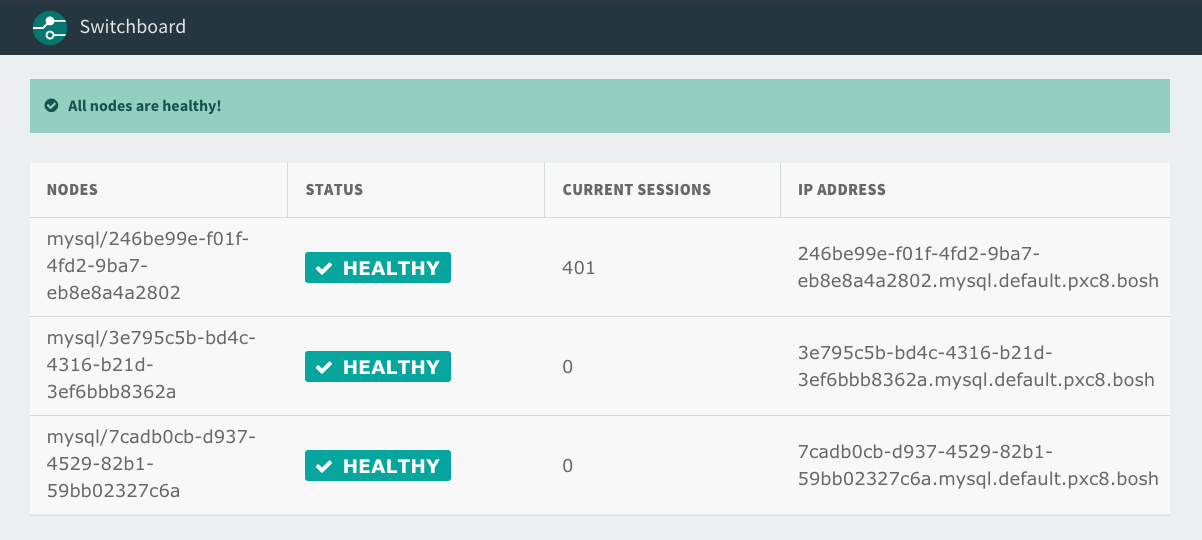
Monitor node health using the dashboard
To monitor node health using the Switchboard dashboard, do the following:
-
To view a list of proxies in your browser, navigate to the hostname that you recorded in Prerequisite. For example,
proxy.YOUR-SYSTEM-DOMAIN.TLD -
When prompted, enter the user name and password that you recorded in Prerequisite.
-
Click the link for the proxy that you want to use to monitor node health.
-
If you are prompted, enter the user name and password that you recorded in Prerequisite.
Monitor node health using the API
You can also use the Switchboard API to obtain the information that is shown on the Switchboard dashboard.
For example, you might want to use the API to write your own app to monitor the cluster.
To monitor node health using the Switchboard API, do the following:
-
To monitor node health, run the following command:
curl -u PROXY-API-USERNAME:PROXY-API-PASSWORD https://PROXY-VM-INDEX-HOSTNAME/v0/backendsWhere:
PROXY-API-USERNAMEis theusernameyou recorded in Prerequisite above.PROXY-API-PASSWORDis thepasswordyou recorded in Prerequisite above.PROXY-VM-INDEXis either 0, 1, or 2 depending on the proxy you want to connect to.HOSTNAMEis thehostnameyou recorded in Prerequisite above.
The preceding command outputs a JSON object similar to the following:
$ curl -u PROXY-API-USERNAME:PROXY-API-PASSWORD https://0-proxy.YOUR-SYSTEM-DOMAIN.TLD/v0/backends
[
  {
    "host": "a-b1234c5d6.e-f891.bosh",
    "port": 6033,
    "healthy": true,
    "name": "mysql/30a13eb4-b3e0-45f8-8449-8dfada826db2",
    "currentSessionCount": 401,
    "active": true,
    "trafficEnabled": true
  },
  {
    "host": "a-b1234c5d6.e-f891.bosh",
    "port": 6033,
    "healthy": true,
    "name": "mysql/742cb991-b818-4b1f-b1bb-f45d834d8df6",
    "currentSessionCount": 0,
    "active": false,
    "trafficEnabled": true
  },
  {
    "host": "a-b1234c5d6.e-f891.bosh",
    "port": 6033,
    "healthy": true,
    "name": "mysql/fc680458-977e-4d1e-8aa5-5ee62fe3e8cc",
    "currentSessionCount": 0,
    "active": false,
    "trafficEnabled": true
  }
]
Node health status
Before routing traffic, the proxy queries an HTTP health check process running on the node. This health check can return as either healthy or unhealthy, or the node can be unresponsive.
Healthy nodes
If the health check process returns HTTP status code 200, the proxy includes the node in its pool of healthy nodes.
When a new or resurrected nodes rejoin the cluster, the proxy continues to route all connections to the active node. In the case of failover, the proxy considers all healthy nodes as candidates for new connections.
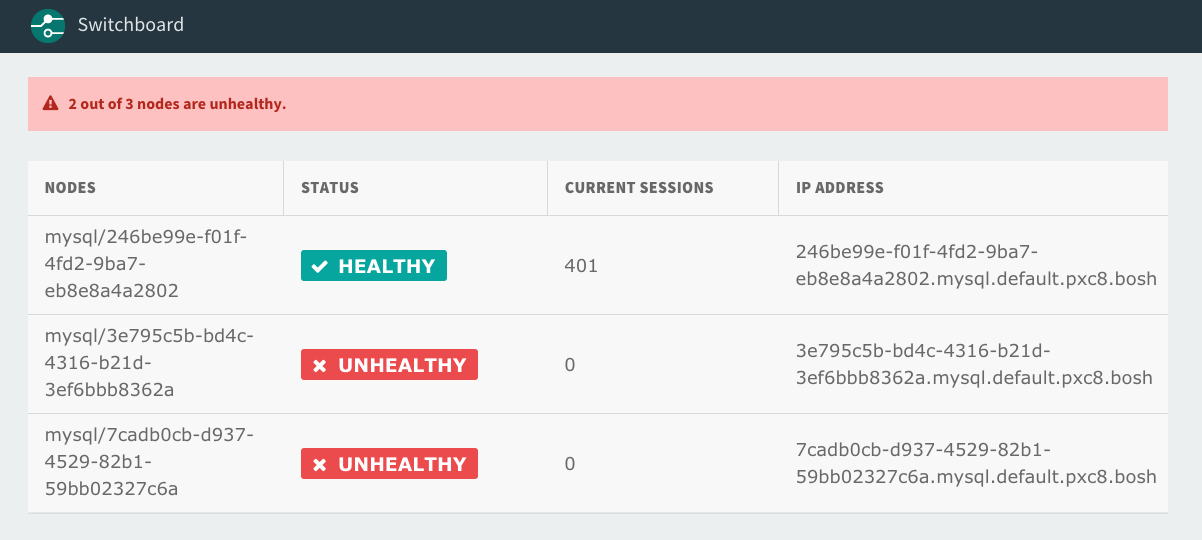
Unhealthy nodes
If the health check returns HTTP status code 503, the proxy considers the node unhealthy.
This happens when a node becomes non-primary. For more information, see About Multi-Site Replication.
The proxy closes existing connections to the unhealthy node. The proxy routes new connections to a healthy node, assuming such a node exists. Clients are expected to handle reconnecting on connection failure if the entire cluster becomes inaccessible.
Unresponsive nodes
If node health cannot be verified due to an unreachable or unresponsive health check endpoint, the proxy considers the node unhealthy. This can happen if there is a network partition or if the VM running the node and health check failed.
