


This topic describes how to collect metrics and monitor VMware Postgres Operator instances in a Kubernetes cluster.
Overview
VMware Postgres Operator uses the Postgres Exporter, a Prometheus exporter for Postgres server metrics. The Prometheus exporter provides an endpoint for Prometheus to scrape metrics from different application services. The Postgres Server Exporter shares metrics about the Postgres instances.
Upon initialization, each Postgres pod adds a Postgres server exporter container. Prometheus sends HTTPS requests to the exporter. The exporter queries the Postgres database and provides metrics in the Prometheus format on a /metrics https endpoint (port 9187) on the pod, conforming to the Prometheus HTTP API.
The diagram below shows the architecture of a single-node Postgres instance with Postgres server exporter, where the metrics are exported on port 9187:

Prometheus could be your primary consumer of the metrics, but any monitoring tool can take advantage of the /metrics endpoint.
Prerequisites
To take advantage of the metrics endpoint, ensure your environments has a metrics collector like Prometheus, or Wavefront. For an example installation of Prometheus, see Using Prometheus Operator to Scrape the VMware Postgres Operator Metrics.
Verifying Postgres Metrics
The VMware Postgres Operator pods include the exporter that emits the built-in Postgres metrics. To test that the metrics are being emitted, you may use port forwarding (for more details see Use Port Forwarding to Access Applications in a Cluster in the Kubernetes documentation):
kubectl port-forward pod/<postgres-instance-pod-name> 9187:9187
And then in another shell window, use a tool like curl to run:
curl -k https://localhost:9187/metrics
A successful output would show metrics emitted by the exporter, similar to (this example is a small extract):
# HELP pg_stat_database_xact_rollback Number of transactions in this database that have been rolled back
# TYPE pg_stat_database_xact_rollback counter
pg_stat_database_xact_rollback{datid="13737",datname="postgres",server="localhost:5432"} 3553
where xact_rollback is part of the pg_stat_database metrics map, as described in Postgres Exporter. For a list of the Postgres relations that are used to retrieve the default VMware Postgres Operator metrics see Postgres Exporter Default Metrics.
Using Prometheus Operator to Scrape the VMware Postgres Operator Metrics
This section demonstrates how to scrape the Postgres metrics using the Prometheus Operator.
The Prometheus Operator defines and manages monitoring instances as Kubernetes resources. This section provides an example installation of the Prometheus Operator, and an example Prometheus PodMonitor CRD (Custom Resource Definition) that will be used demonstrate how to scrape the metrics. The PodMonitor defines the configuration details for the VMware Postgres Operator pod monitoring.
Install the Prometheus Operator using Helm:
For e.g.:
helm install prometheus prometheus-community/kube-prometheus-stack \
   --create-namespace \
   --namespace=prometheus \
   --set prometheus.service.port=80 \
   --set prometheus.service.type=LoadBalancer \
   --set grafana.enabled=false,alertmanager.enabled=false,nodeExporter.enabled=false \
   --set prometheus.prometheusSpec.podMonitorSelectorNilUsesHelmValues=false \
   --wait
Note: In the above prometheus installation example,
prometheus.prometheusSpec.podMonitorSelectorNilUsesHelmValuesis set tofalse. It is configured to avoid the need to add areleaselabel on each PodMonitor CR that you create.If you already have a prometheus installation with
prometheus.prometheusSpec.podMonitorSelectorNilUsesHelmValuesset totrue(default value), then, in order for your PodMonitor CRs to be discoverable by the Prometheus Operator, you will need to add a labelrelease: <prometheus-release-name>to the metadata section of each PodMonitor CR that you create in the cluster. For e.g. if the helm release name isprometheus, you will add a labelrelease: prometheusin the PodMonitor'smetadatasection.Confirm the
PodMonitorCRD exists using:kubectl get customresourcedefinitions.apiextensions.k8s.io podmonitors.monitoring.coreos.comCreate a
PodMonitorthat scrapes all VMware Postgres Operator instances every 10 seconds:cat <<EOF | kubectl apply -f - --- apiVersion: monitoring.coreos.com/v1 kind: PodMonitor metadata: name: postgres-instances namespace: prometheus spec: namespaceSelector: any: true selector: matchLabels: type: data app: postgres podTargetLabels: - postgres-instance podMetricsEndpoints: - port: "metrics" interval: "10s" scheme: https tlsConfig: insecureSkipVerify: true EOFwhere
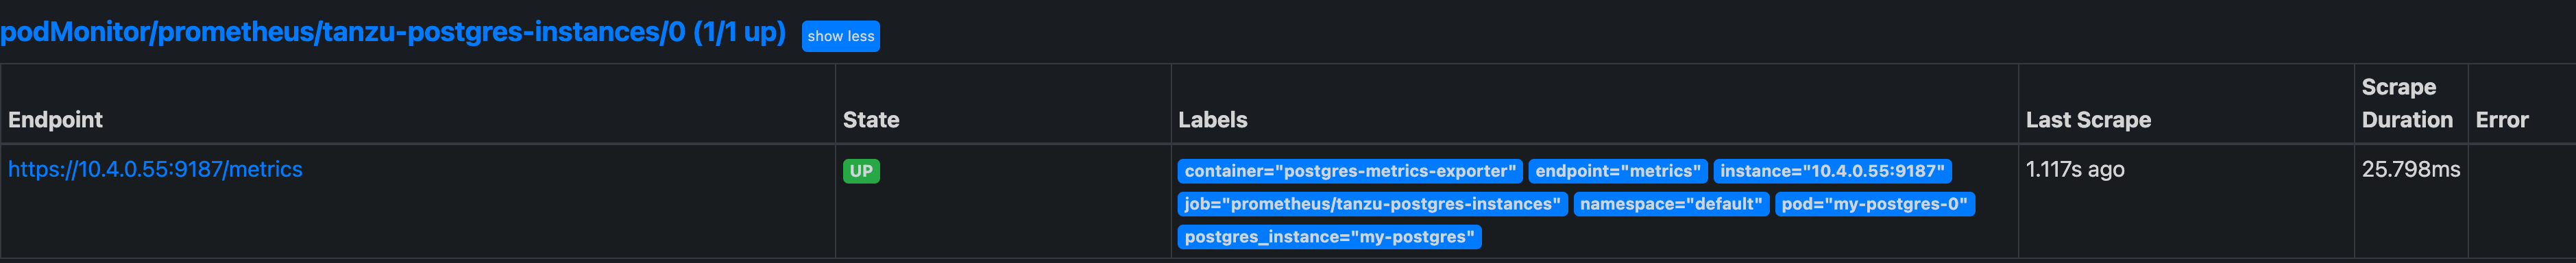
tlsConfig:insecureSkipVerify:trueskips TLS verification.Check if Prometheus is successfully monitoring the instances by opening the Prometheus UI in the browser and visit the
/targetsURI to check the status of thePodMonitorunderpodMonitor/prometheus/postgres-instances/0 (1/1 up).You should see something similar to:
For details on the
PodMonitorAPI see PodMonitor in the Prometheus Operator documentation.
Using TLS for the Metrics Endpoint
The VMware Postgres Operator creates a metrics related TLS certificate during the VMware Postgres Operator initialization. The TLS credentials are stored in a Secret named after the Postgres instance name: if the instance name is postgres-sample, the metrics Secret name is postgres-sample-metrics-tls-secret.
In order to use TLS for a metrics endpoint, configure Prometheus to use the CA certificate from the Secret. Use the following command to fetch the CA certificate:
kubectl get secret <POSTGRES-INSTANCE-NAME>-metrics-tls-secret -o 'go-template={{index .data "tls.crt" | base64decode}}'
where <POSTGRES-INSTANCE-NAME> is the name of the Postgres instance.
For details on how to configure Prometheus with TLS, see tls_config in the Prometheus Configuration documentation.
To enable the Prometheus Operator to scrape metrics from the Postgres instance with TLS verification enabled, create a PodMonitor in the Postgres instance namespace and provide the metrics TLS configuration. An example PodMonitor for a Postgres instance named as postgres-sample is shown below:
cat <<EOF | kubectl apply -f -
---
apiVersion: monitoring.coreos.com/v1
kind: PodMonitor
metadata:
  name: postgres-sample
  namespace: postgres-sample-namespace
spec:
  namespaceSelector:
    matchNames:
      - postgres-sample-namespace
  selector:
    matchLabels:
      type: data
      app: postgres
      postgres-instance: postgres-sample
  podTargetLabels:
  - postgres-instance
  podMetricsEndpoints:
  - port: "metrics"
    interval: "10s"
    scheme: https
    tlsConfig:
      serverName: "postgres-sample.metrics.default"
      ca:
        secret:
          key: tls.crt
          name: postgres-sample-metrics-tls-secret
EOF
where you should replace postgres-sample and postgres-sample-namespace with your Postgres instance name and namespace.
Collecting Metrics in a Secure Namespace
Prometheus will not be able to scrape metrics from Postgres instances that have a strict NetworkPolicy configuration on their namespace. See Network Policy Configuration for a detailed explanation about NetworkPolicy configuration.
Create a NetworkPolicy manifest in the instance namespace to allow traffic flow from the metrics port 9187:
apiVersion: networking.k8s.io/v1
kind: NetworkPolicy
metadata:
  name: allow-metrics-access
  namespace: <INSTANCE_NAMESPACE>
spec:
  podSelector:
    matchLabels:
      app: postgres
      type: data
  policyTypes:
    - Ingress
  ingress:
    - from:
        - namespaceSelector:
            matchLabels:
              networking/namespace: <PROMETHEUS_NAMESPACE>
    - ports:
        - port: 9187
          protocol: TCP
Label the Prometheus namespace to easily use the namespaceSelector section of the NetworkPolicy spec, for example:
kubectl label namespace prometheus networking/namespace=prometheus
namespace/prometheus labeled
Save the sample yaml to a file, and apply to the cluster:
kubectl apply -n INSTANCE-NAMESPACE -f metrics-network-policy-sample.yaml
networkpolicy.networking.k8s.io/allow-metrics-access created
Postgres Exporter Default Metrics
The built-in metrics that are supported by the Postgres Exporter are listed below:
- pg_stat_bgwriter
- pg_stat_database
- pg_stat_database_conflicts
- pg_locks
- pg_stat_replication
- pg_replication_slots
- pg_stat_archiver
- pg_stat_activity
- pg_settings
For more details, see Postgres Exporter Metrics Map.
