You can connect to VMware vCenter Server and select vSAN-Health Check to get the health report of the vSAN Clusters by collecting logs and other information. Successful analysis generates the detailed report having the list of issues in VMware vSAN Storage.
The VMware vSAN storage Health Check plug-in has health checks related to the VMware vSAN Storage Clusters.
Prerequisites
Verify that you have login credentials for VMware Skyline Health Diagnostics.
Verify that you have the VMware vCenter Server user name and password.
Verify that the VMware vCenter Server has administrative roles and permissions to collect logs and health information.
Verify that the VMware vCenter user has following privileges
Admin privilege
Procedure
- Select
VMware vSANfrom the Product Workflow list.
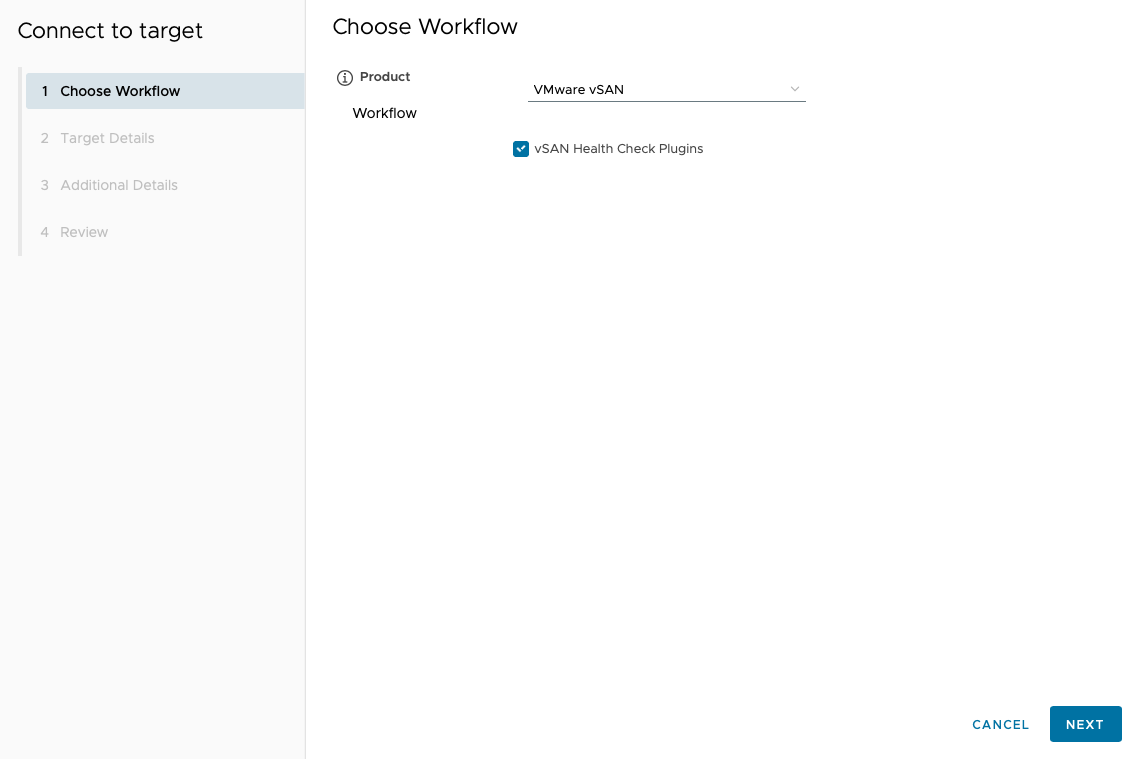
- Click NEXT.
Target Details page to input the VMware vCenter Server details will be displayed.
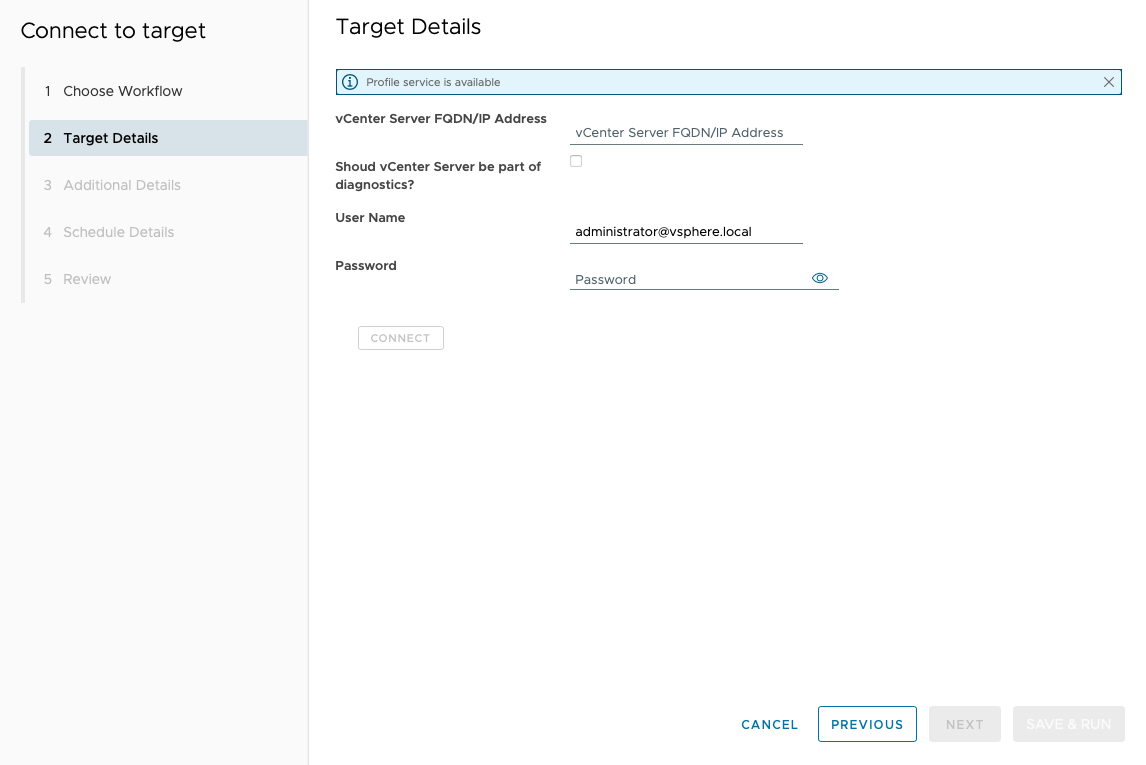
- Click CONNECT.
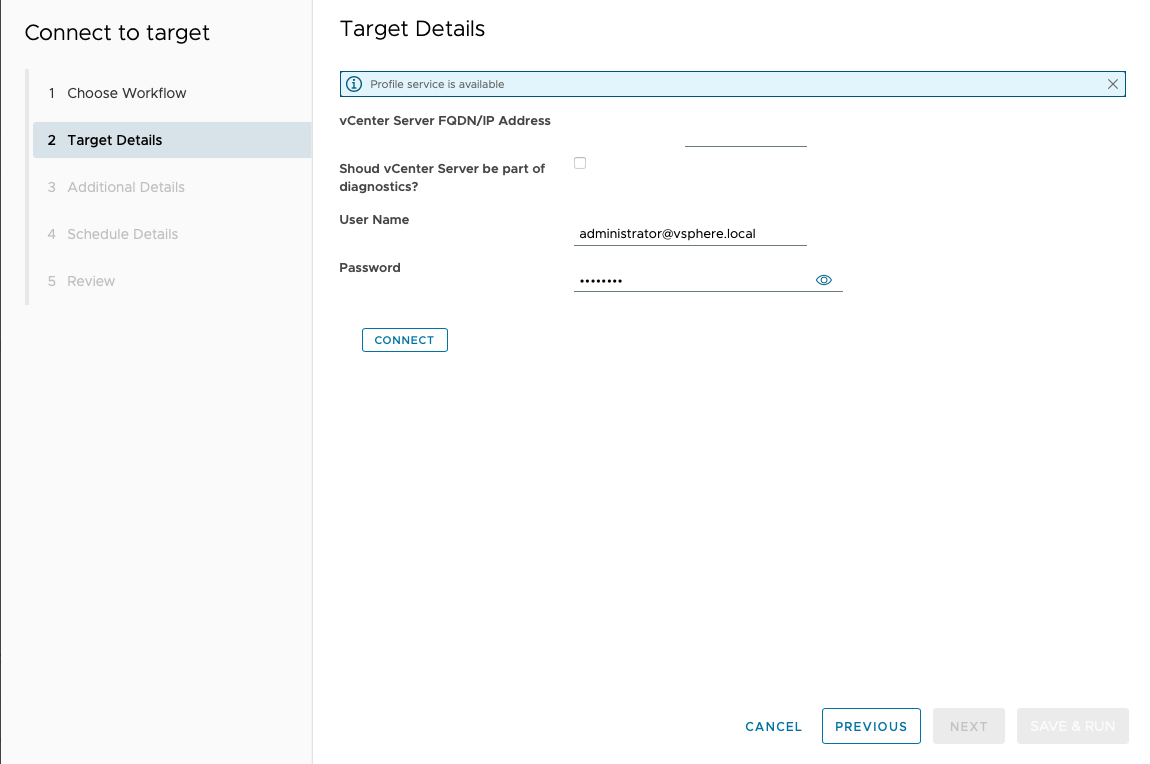
- Click CONNECT to validate the credential and establish connection with the VMware vCenter Server. If connection is successful the inventory will be displayed.
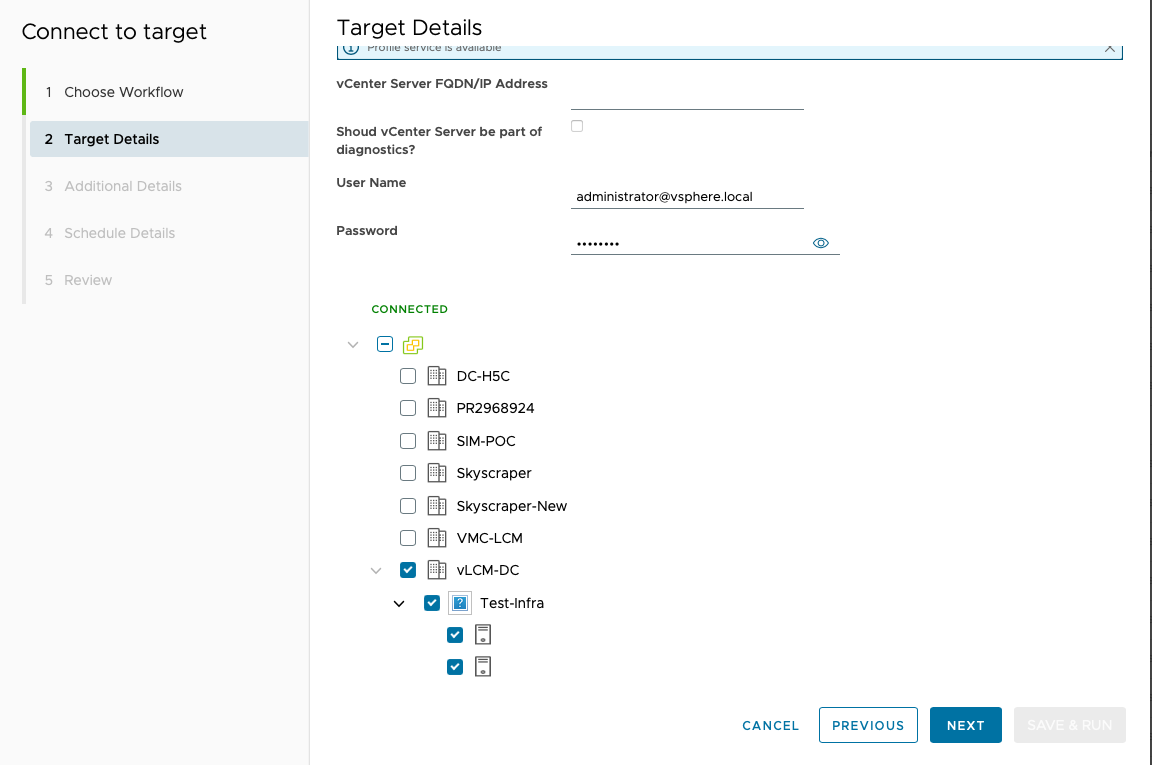
- Select one or more workload domain cluster and click NEXT.
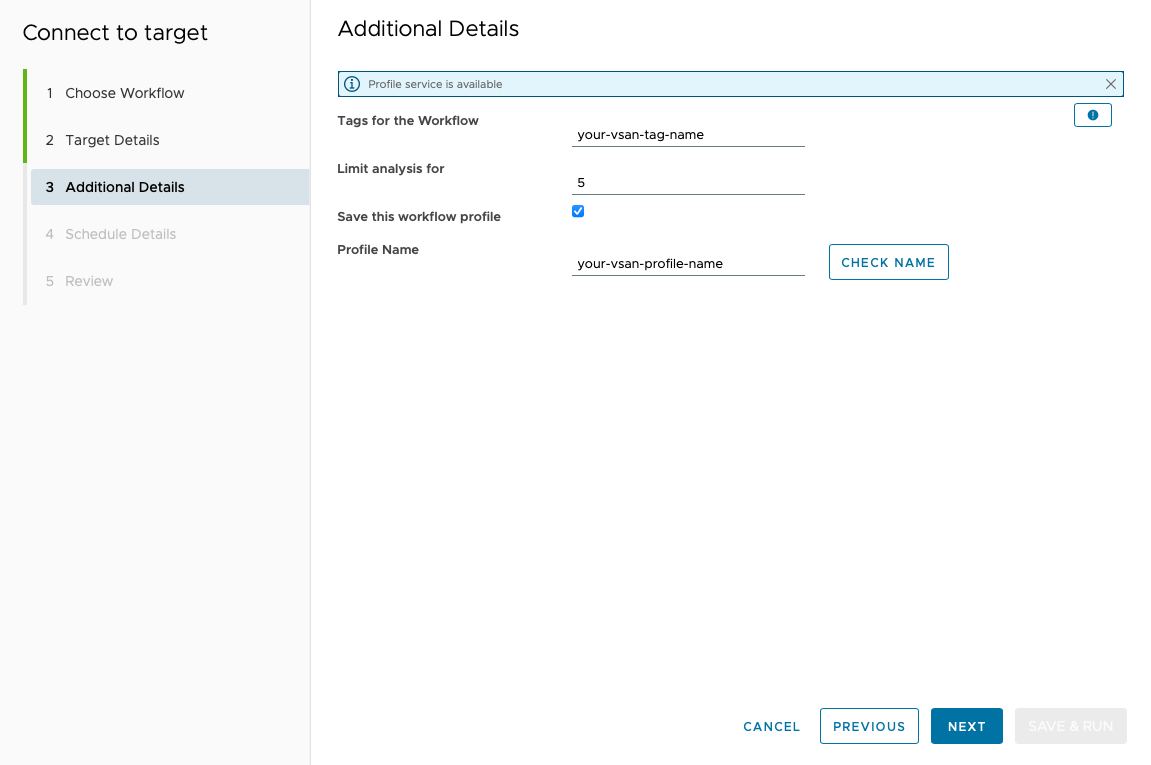
Additional details page will be displayed.
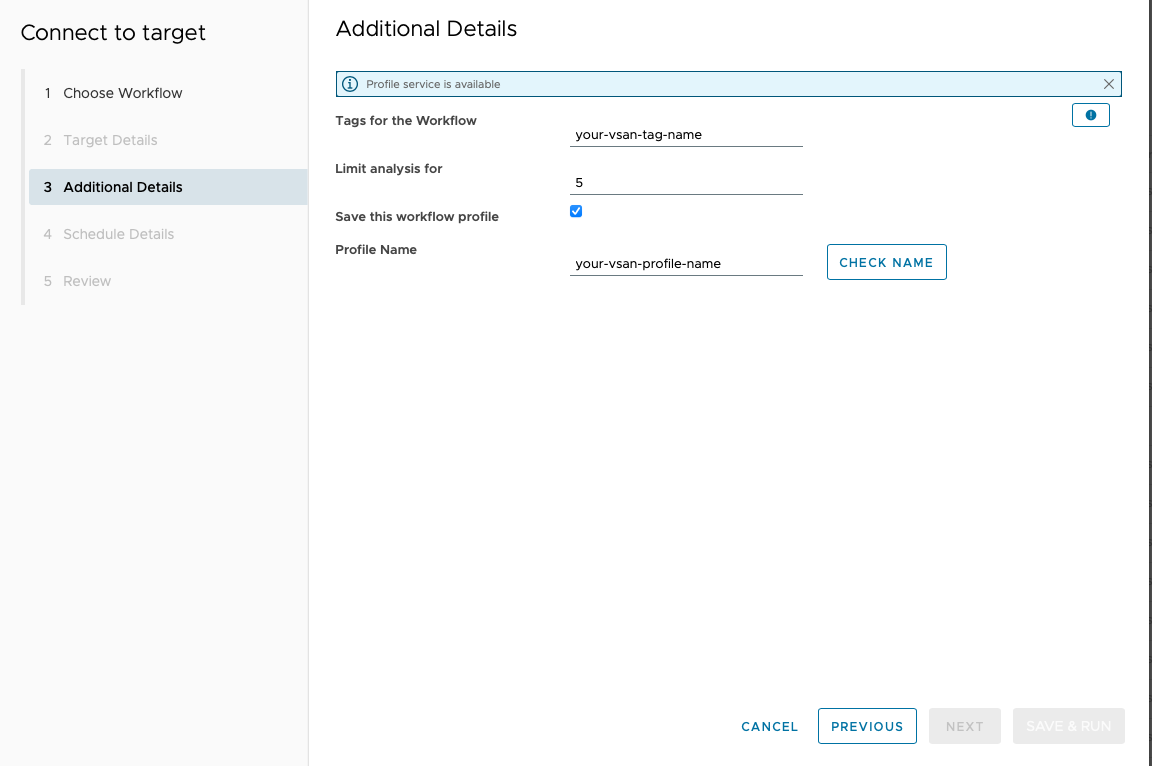
- Click CHECK NAME to validate the provided name is unique and does not conflict with the existing profile name. Once its validated NEXT button will be enabled.
- Select distribution group name from the distribution list to receive email disaplyed under
Notification Distribution Group.
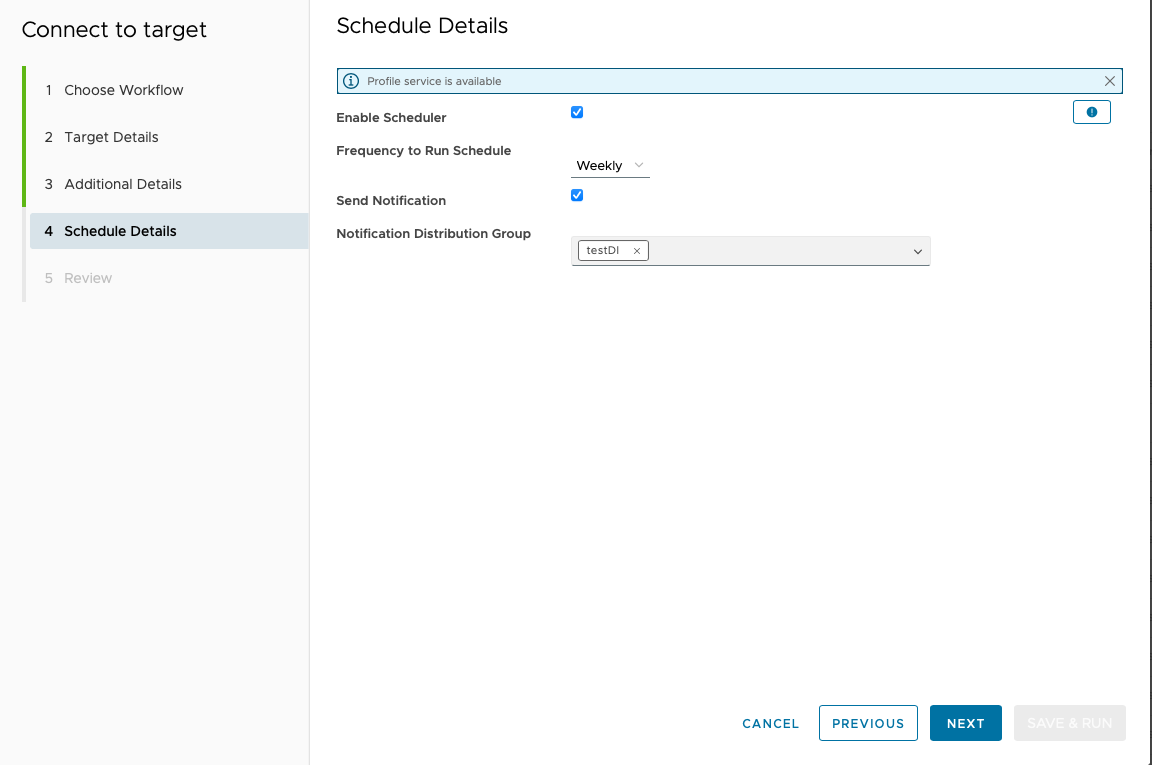
- Click NEXT to see Review summary page.
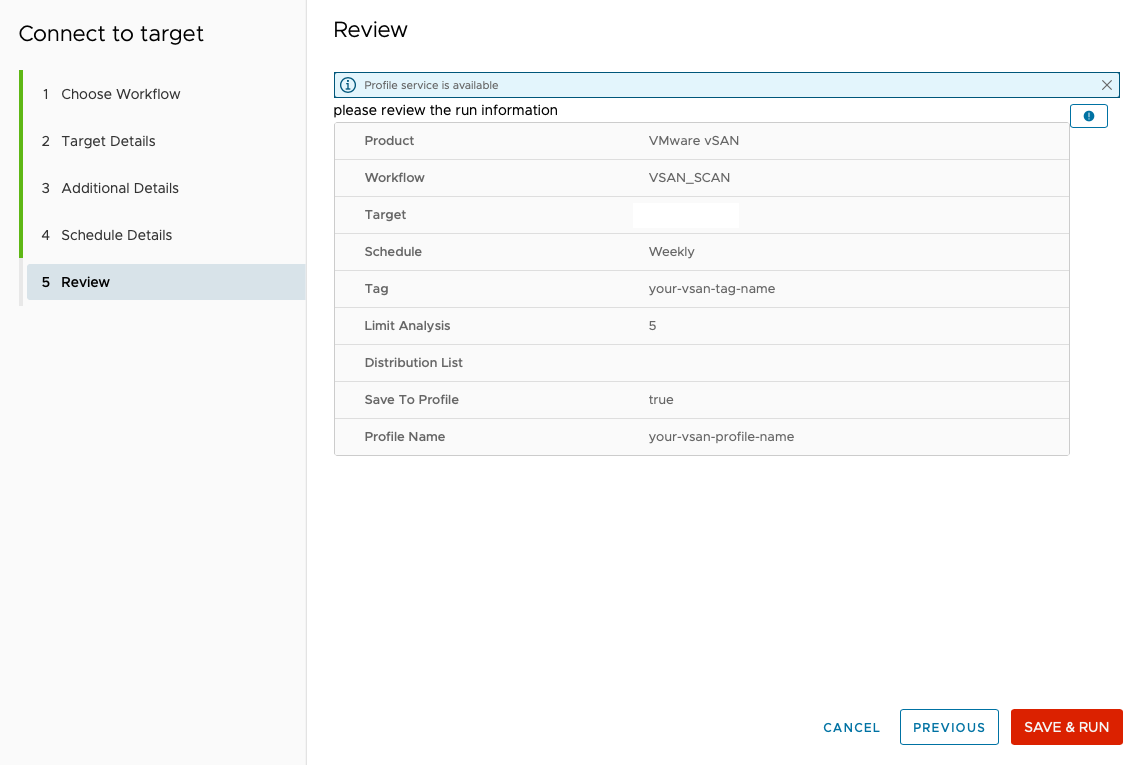
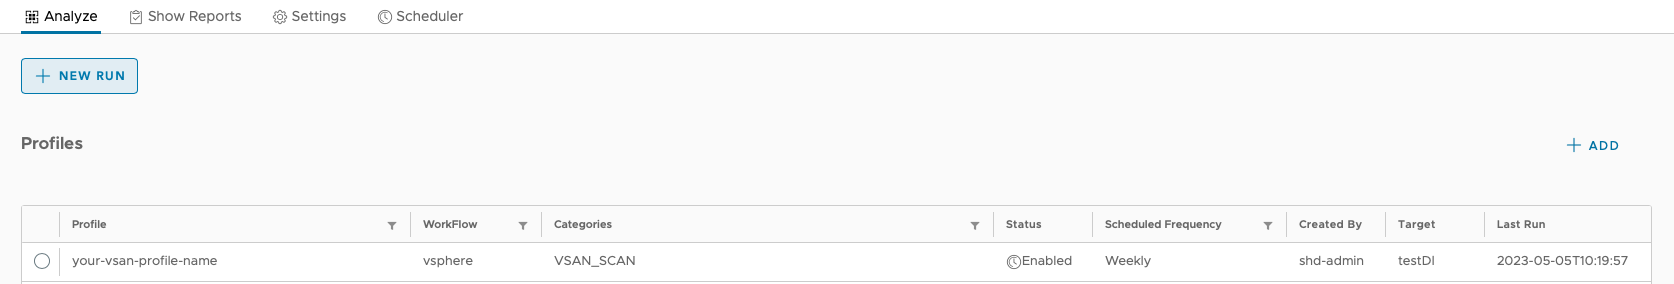
- If you opted to save the profile, profile for this run get saved and visible under Profile pane.
- The task for this run is visible under Task pane.
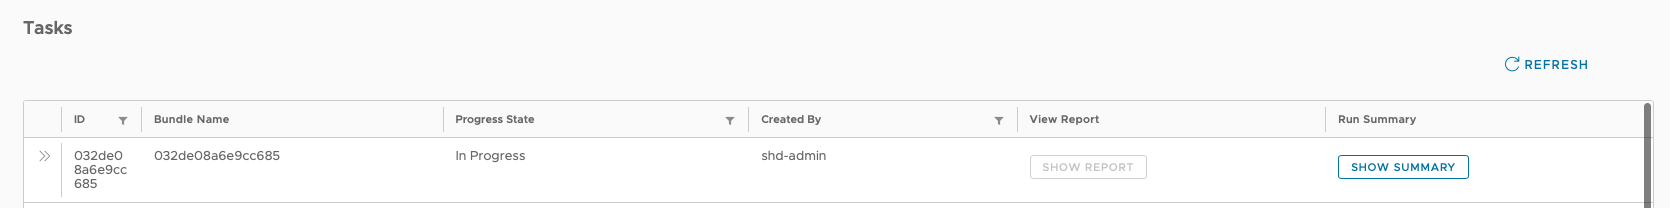
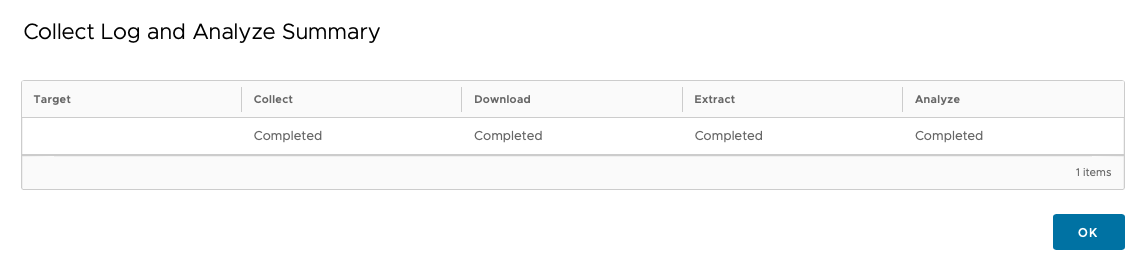
- To check the progress of this task by clicking the SHOW SUMMARY.
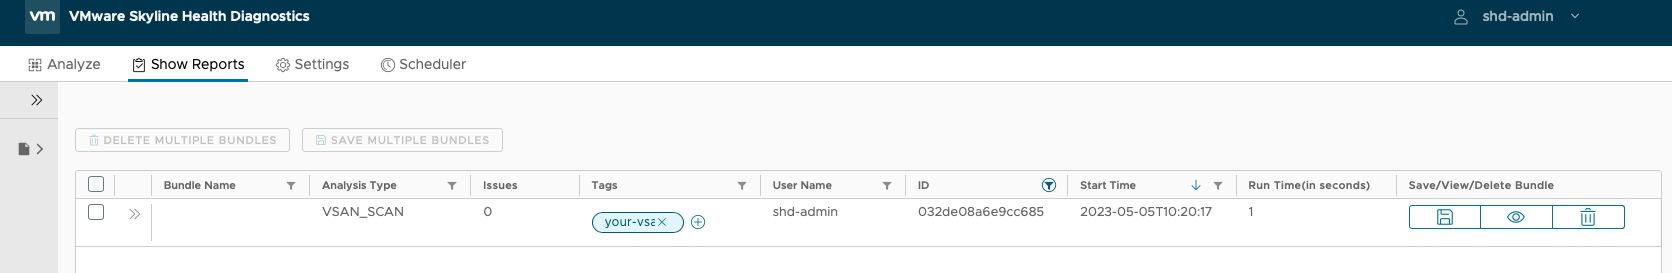
- To view the report of this task or analysis run click SHOW REPORT.