You can connect to VMware Cloud Foundation SDDC Manager and select SDDC Health Check or VMware Security Advisor to get the health & security report of the products by collecting logs and other information. Successful analysis generates the detailed report having the list of issues in VMware Cloud Foundation environment.

The VMware Cloud Foundation Health Check has health checks related to the VMware Cloud Foundation workload domains and management domains for the products that includes

  • vCenter Server

  • ESXi

  • VMware NSX

  • VMware Cloud Foundation SDDC Manager

  • VxRail Manager

  • VMware vRealize Automation

  • VMware vRealize Operations

  • VMware vRealize Log Insight

  • VMware vRealize Life Cycle Manager

Prerequisites

  • Make sure that VMware Cloud Foundation environment, you are trying to diagnose is on version 4.0 or above.

  • Make sure that you have login credentials for VMware Skyline Health Diagnostics.

  • Verify that you have the VMware Cloud Foundation SDDC Manager user name and password for the single-sign on user.

  • Verify that the VMware Cloud Foundation user has administrative roles and permissions to collect logs and health information.

  • Verify that the VMware Cloud Foundation user has following privileges

    • Admin privilege

Procedure

  1. Log in to the VMware Skyline Health Diagnostics UI using the Web browser.
  2. In the top-menu, click Analyze.
  3. Click New Run.
  4. In the Connect to target dialog box, in the Choose Workflow pane select VMware Cloud Foundation under the Product.
  5. Select Non-Exclusive VMware Cloud Foundation to run diagnostics, health and VMware Security Advisory Plugins.
  6. Select the one or more appropriate plugin to be included in the analysis run.
    1. Select SDDC Manager Diagnostics Plugins to diagnose the issues related to SDDC Manager.
    2. Select SDDC Health Check Plugins to diagnose health realted issues of the SDDC.
    3. Select VMware Security Advisor Plugins to diagnose the security related issues.
  7. Enter the SDDC Manager hostname or IP address in SDDC Manager FQDN/IP Address text box.

    If SDDC Manager Server is not running on default port 443, append the port number to the hostname or IP address with colon.

    Example: https://SDDC-Manager_Hostname:Port

  8. Enter the SDDC Manager Server SSH user name in the SSH User Name . A root user name if recommended to run the checks which required root privileges
  9. Enter the password for the SSH user in the SSH User Password.
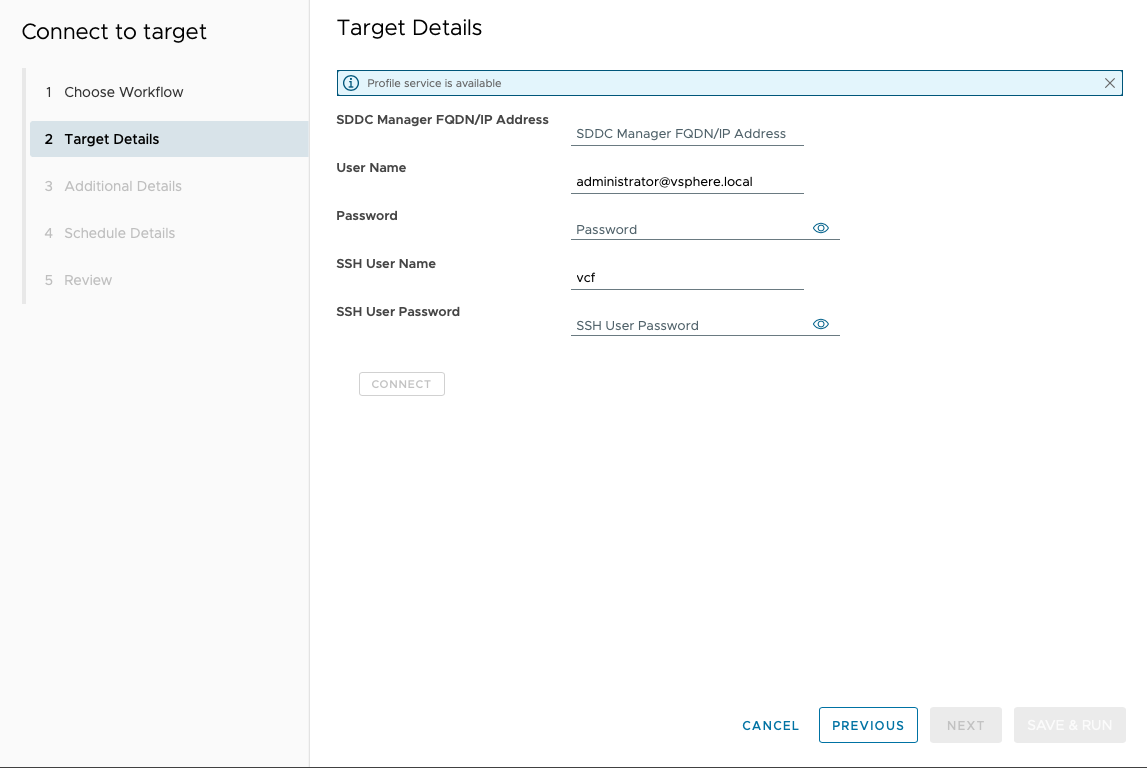

  10. Click CONNECT.

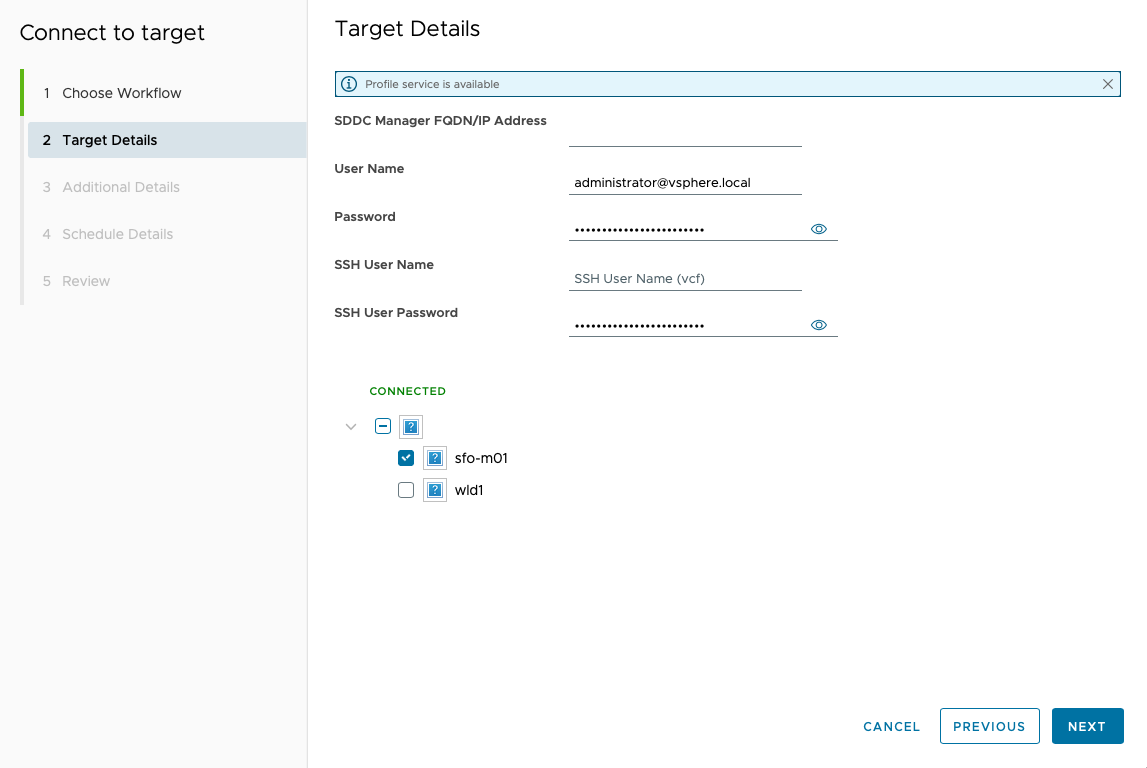
    This action validates the credential by performing a login to the given SDDC Manager Server.

    On successful connection to SDDC Manager, the inventory will be displayed .


  11. Select one or more available domains.
  12. Click NEXT.
  13. Provide the unique tag name for this workflow if you like to search the report later, using the Tag for the Workflow text box.
  14. Provide the number of days to limit the analysis using Limit Analysis for text box.
  15. Select Save this workflow profile , if you want to use the same settings in future. Once profile is saved, you do not need to re-enter all the details for the run again.
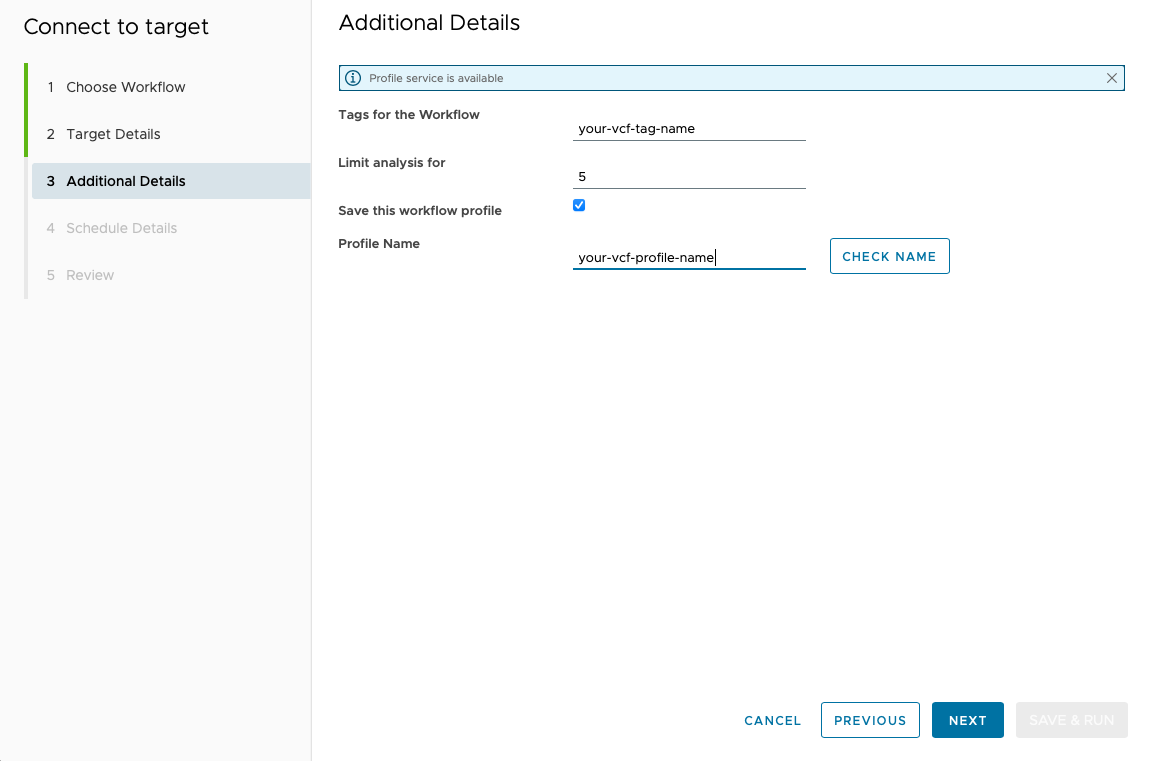
  16. Provide the unique profile name to this profile if you like to save this profile for future use, using Name for this Profile text box.


  17. Click NEXT.
  18. Select Enable Scheduler, if you want to schedule this run on daily, week or monthly basis.
  19. Select the frequency of schedule using Frequency to Run Schedule list box.
  20. Select Send Notification to receive the report of the analysis run over email.
  21. Select distribution group name from the distribution list to receive email disaplyed under Notification Distribution Group.


  22. Click NEXT.
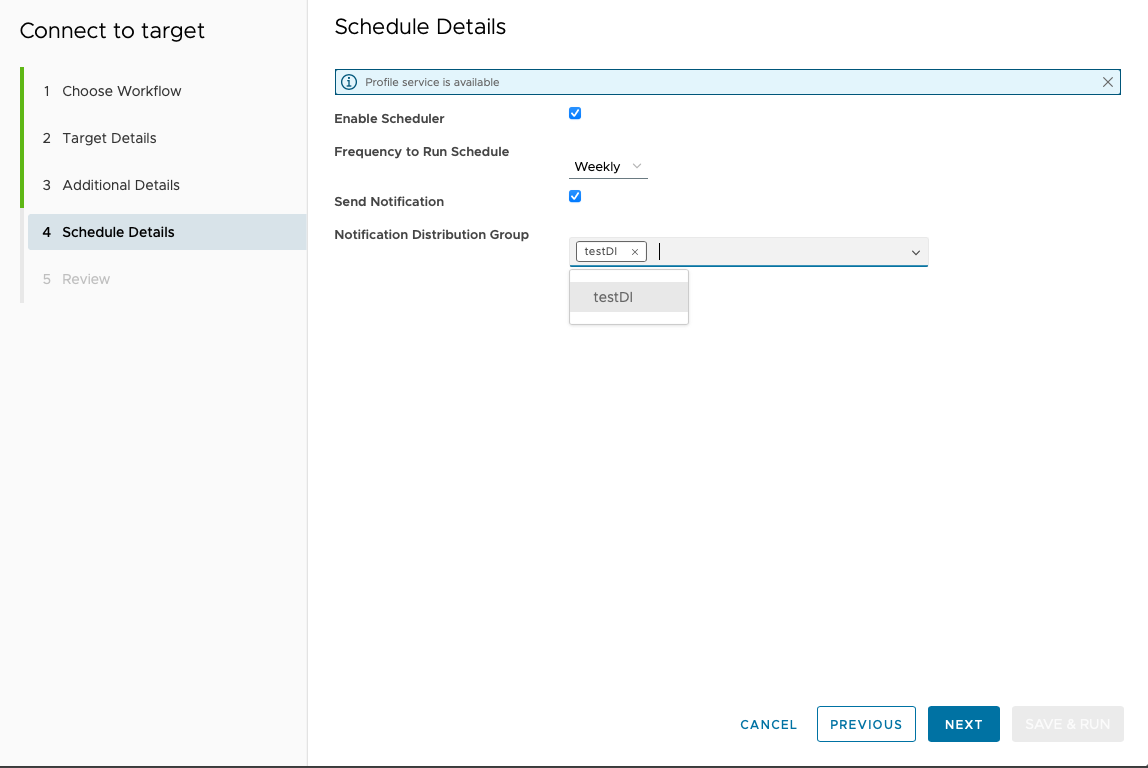
  23. Review the summary information.
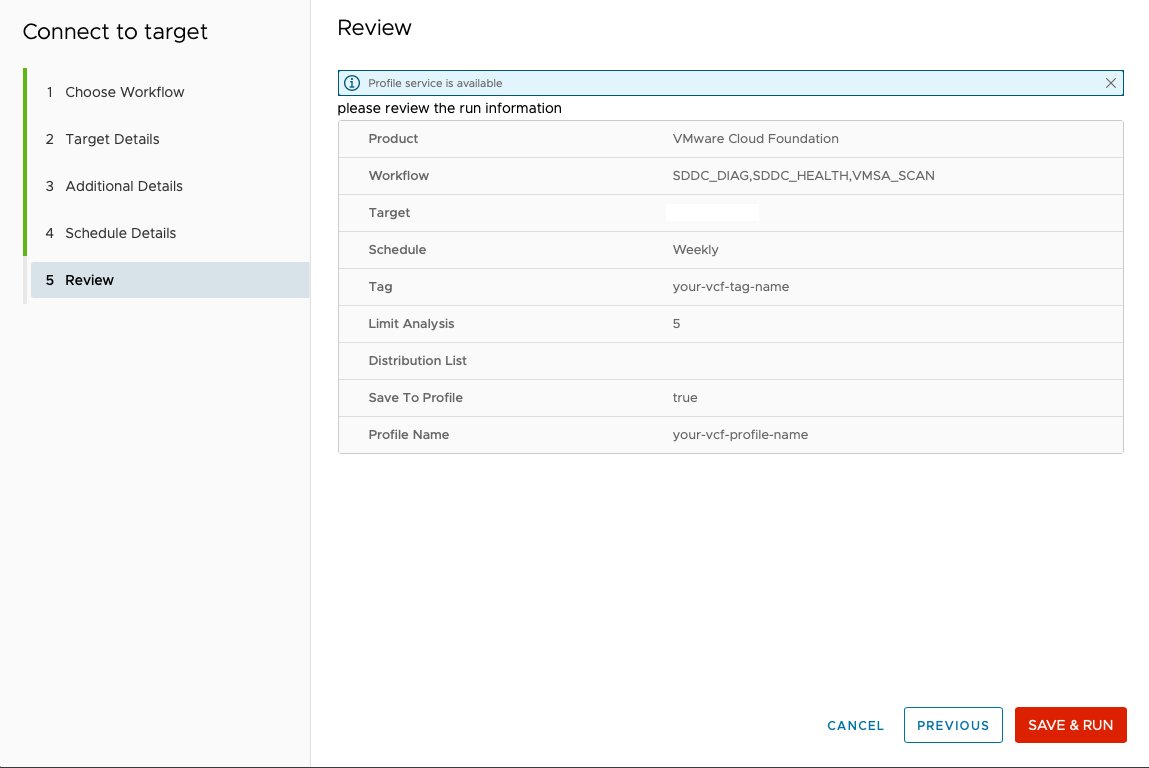

  24. Click SAVE & RUN.

    Profile with the name get created.


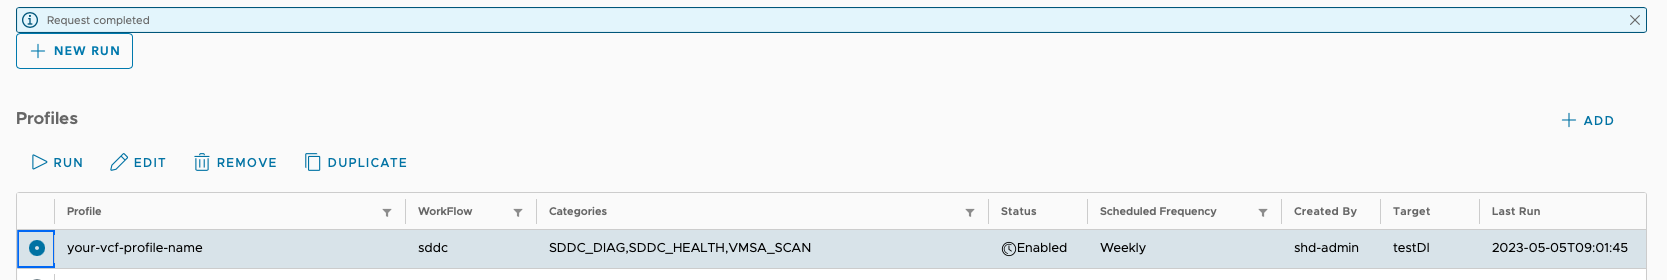
    Task progress shown in the task pane.


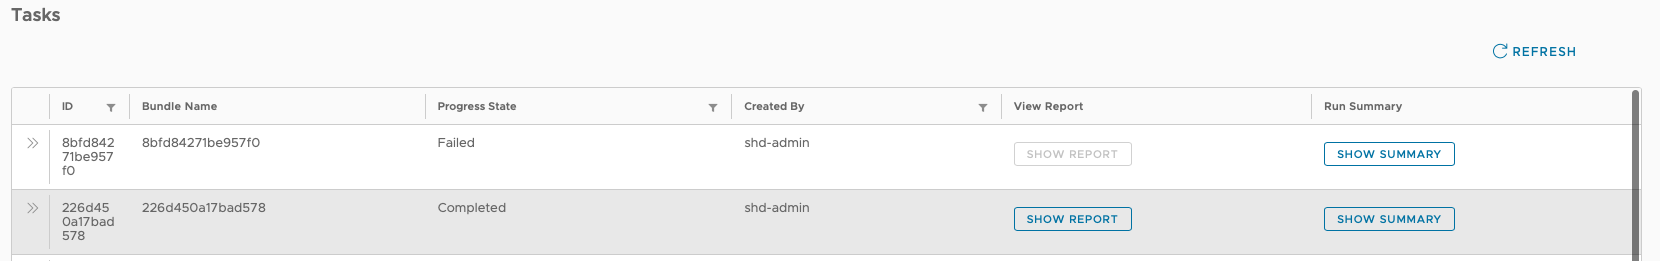
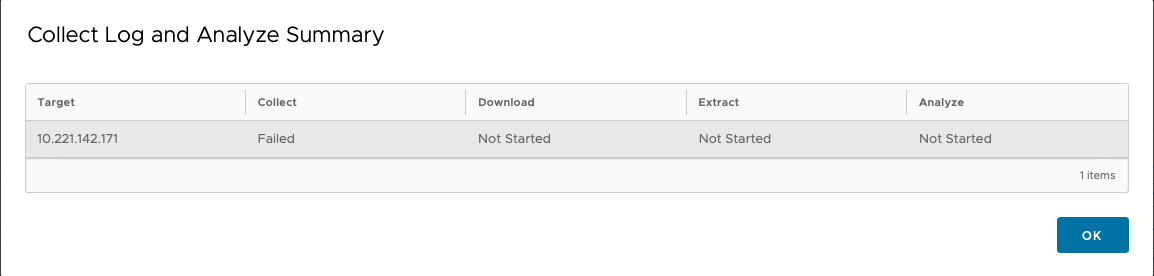
  25. Click SHOW SUMMARY in task pane to see the task progress.

    Task status progress.


  26. Click SHOW REPORT to see the detailed report of the analysis run.
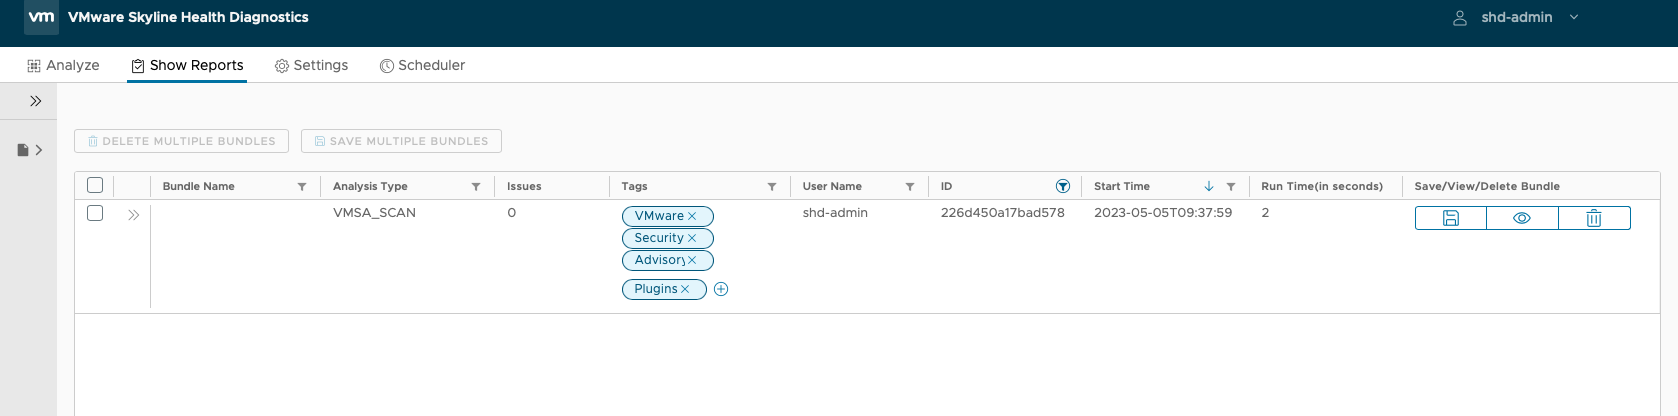
  27. To download the analysis report, click the SAVE icon.